🌍 Public
ICE8_Country Map
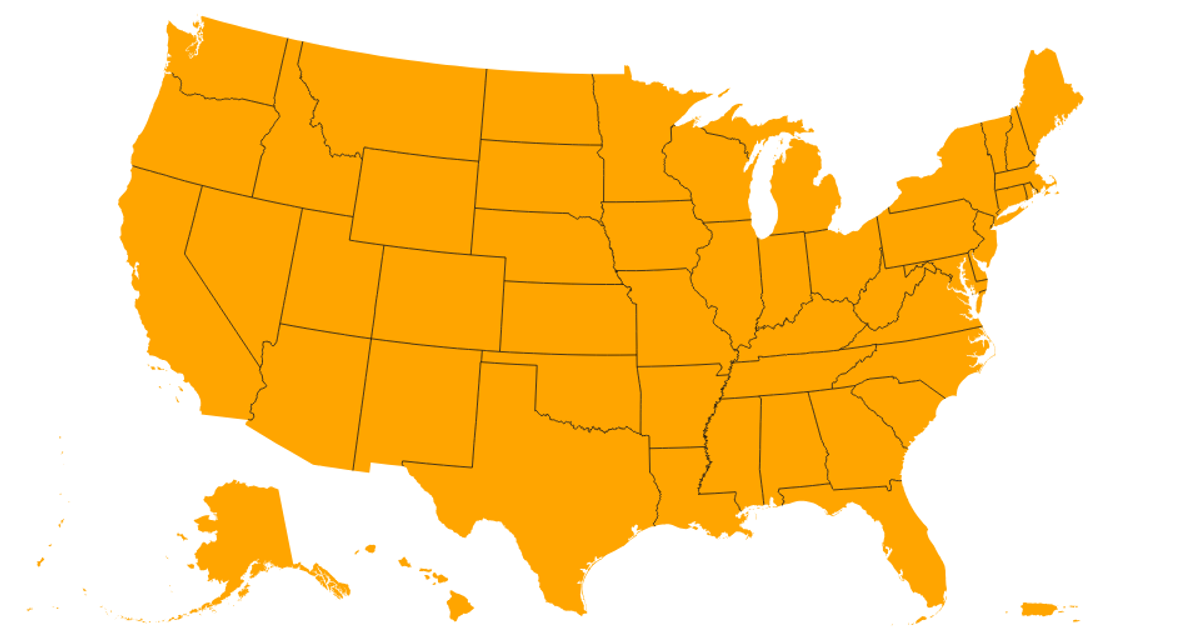
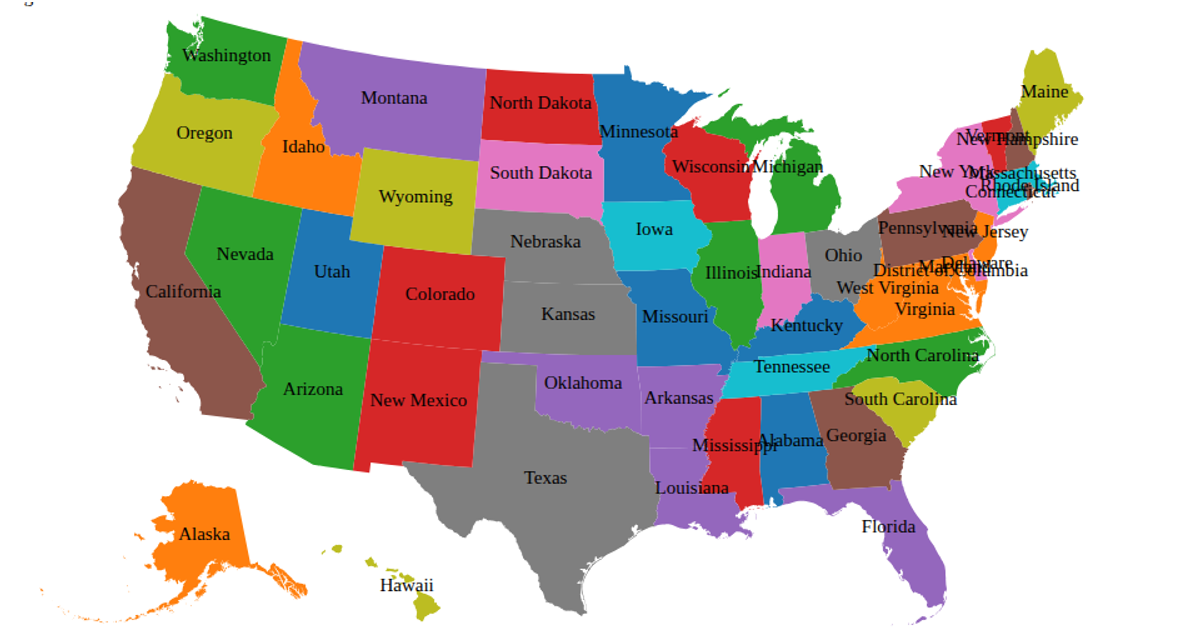
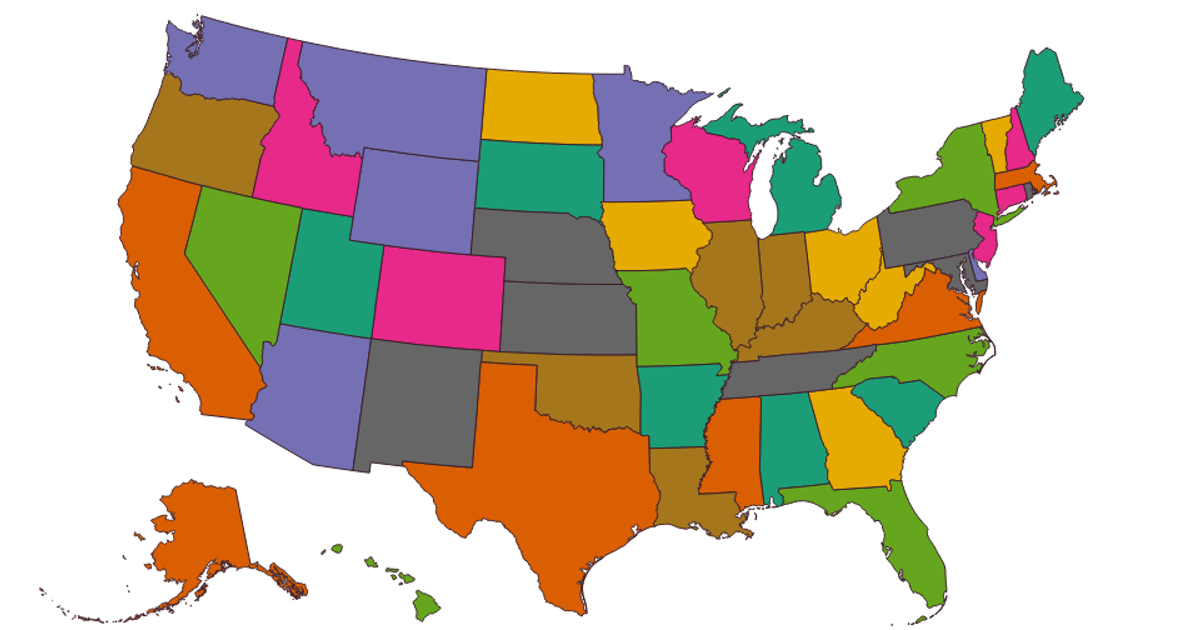
This map visualizes comparative state-level index scores across the United States, using an orange sequential color scale to encode values from a CSV dataset. Hovering over each state reveals its name and score via an interactive tooltip. Built with D3 v7 and TopoJSON, the visualization uses d3.geoPath and d3.geoAlbersUsa to render state boundaries from the us-atlas TopoJSON file, with a gradient legend showing the color-to-value mapping.
AI-generated descriptionMIT Licensed


Comments
Sign in to join the discussion.