🌍 Public
template scatter animation
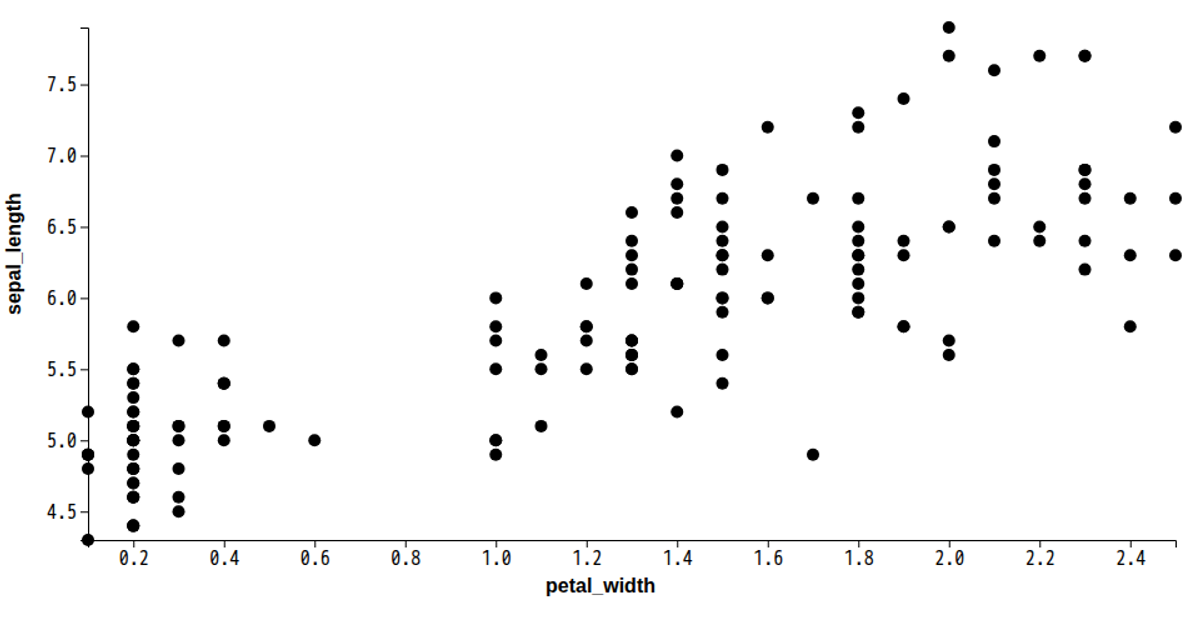
This example shows a scatter plot animation that cycles through three datasets, redrawing points along a diagonal line in red and then transitioning to blue. A timer updates the chart every two seconds, revealing a new series and clearing the previous one by setting an empty series first. Built with ECharts 4.1.0 and jQuery, it uses `setOption` with `animationDelay` and `animationEasingUpdate` to stagger point transitions, while the chart is initialized via `echarts.init` on a DOM container.
AI-generated descriptionDemonstrates fundamental DOM manipulation.
MIT Licensed







Comments
Sign in to join the discussion.