🌍 Public
Fork of Fork of ICE 7 Area Chart
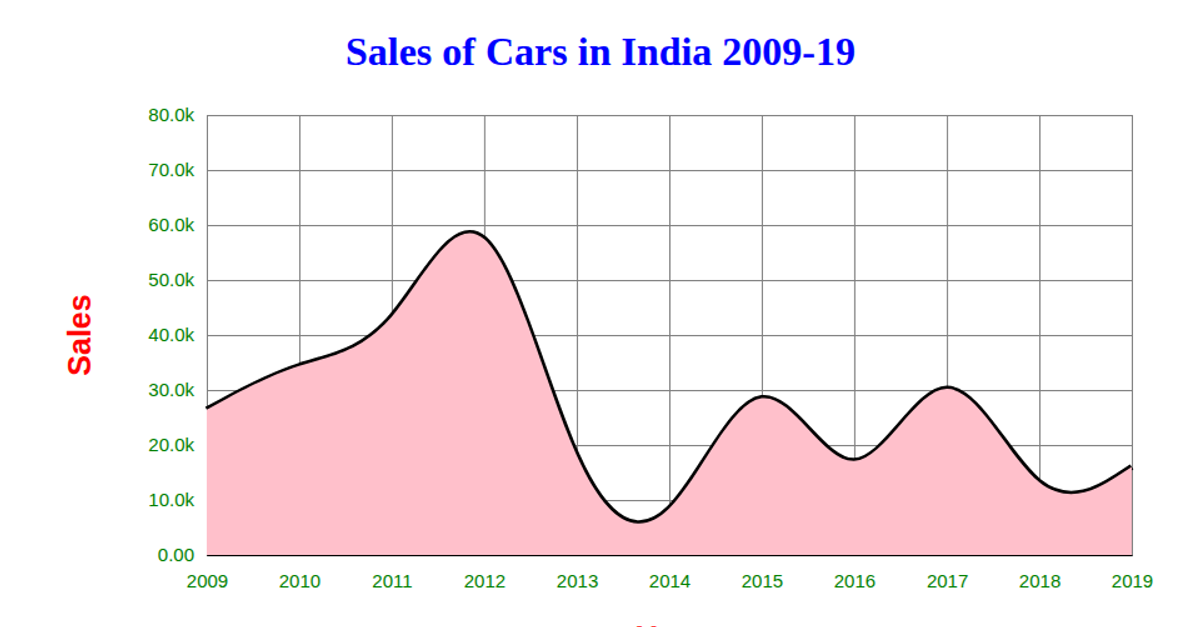
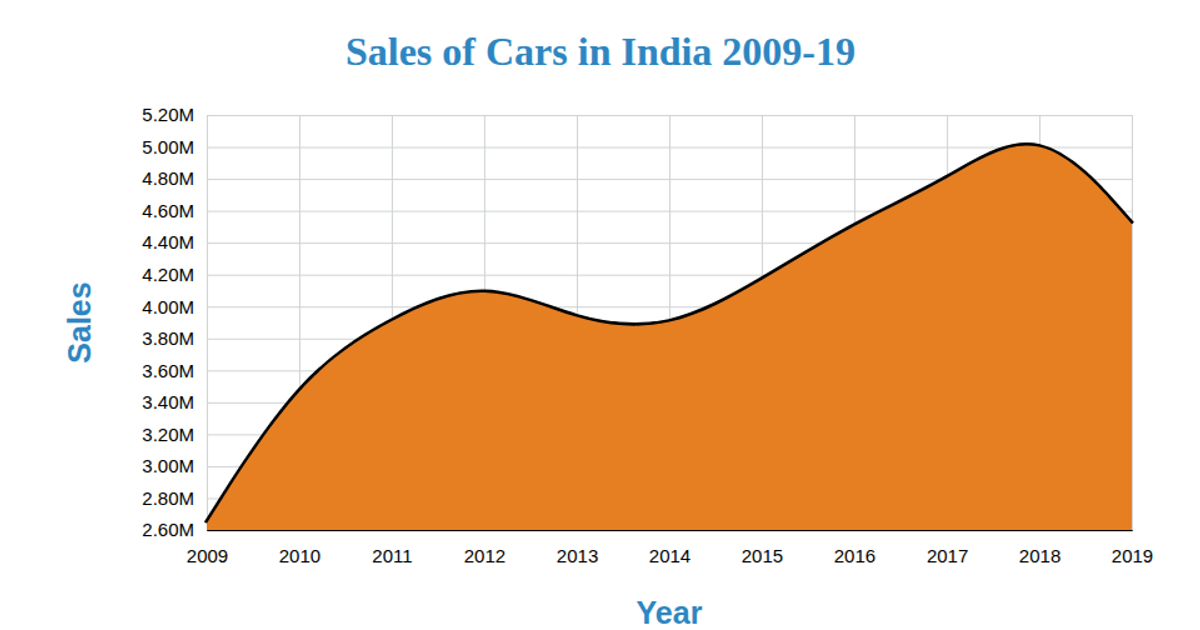
This visualization displays vehicle sales in India from 2009 to 2022, combining a smooth line chart with a filled area beneath it to emphasize sales trends over time. The SVG-based chart uses D3 v5 APIs including `line`, `area`, `curveBasis`, `scaleLinear`, `scaleTime`, `axisLeft`, and `axisBottom`. It loads CSV data from a GitHub gist, formats year and sales values as numbers, and renders axes with gridlines, axis labels, and a colored area fill using the `area` generator.
AI-generated descriptioncombined line and area charts
MIT Licensed


Comments
Sign in to join the discussion.