🌍 Public
Fork of Customizing Axes
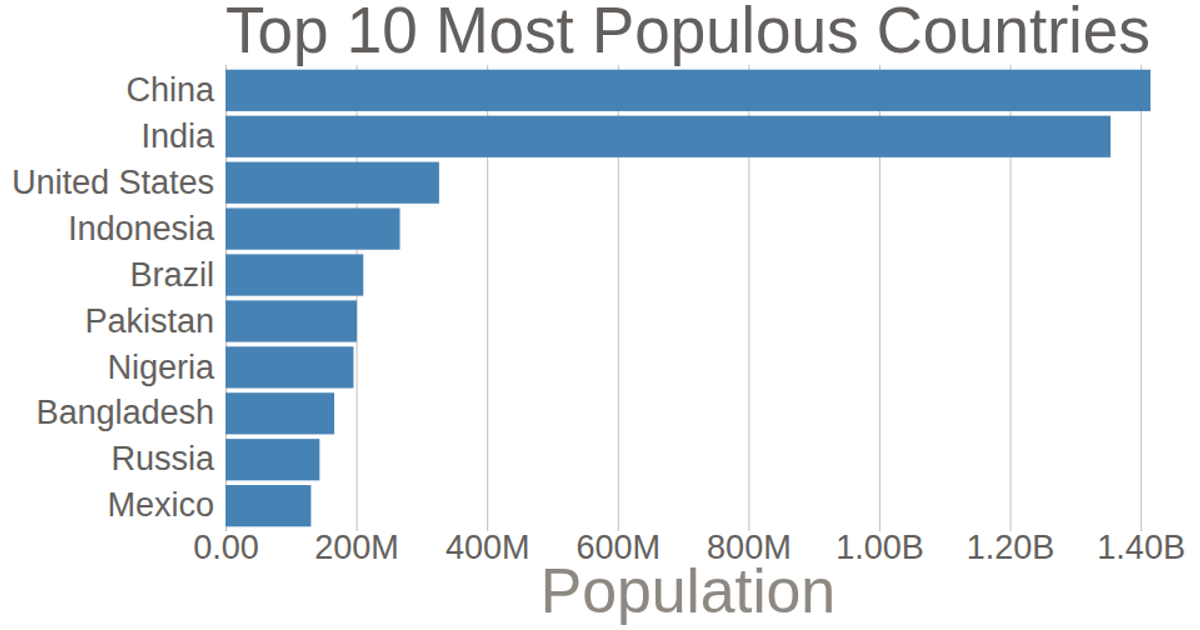
This bar chart shows the populations of the top 10 most populous countries, sourced from the 2017 United Nations World Population Prospects. It demonstrates d3.axisBottom and d3.axisLeft with custom tick formatting, using d3.format to abbreviate population values (e.g., converting “G” to “B”). The chart uses d3.scaleLinear and d3.scaleBand with margins, removing default axis domains and styling text via CSS, while rendering to SVG.
AI-generated descriptionThis bar chart shows population of the top 10 most populous countries. The data comes from the year 2018 estimate in United Nations: World Population Prospects 2017. It also demonstrates customization of D3 axes.
See also the first bar chart visualization that this one builds on: Making a Bar Chart.
MIT Licensed




Comments
Sign in to join the discussion.