🌍 Public
Making a Bar Chart!
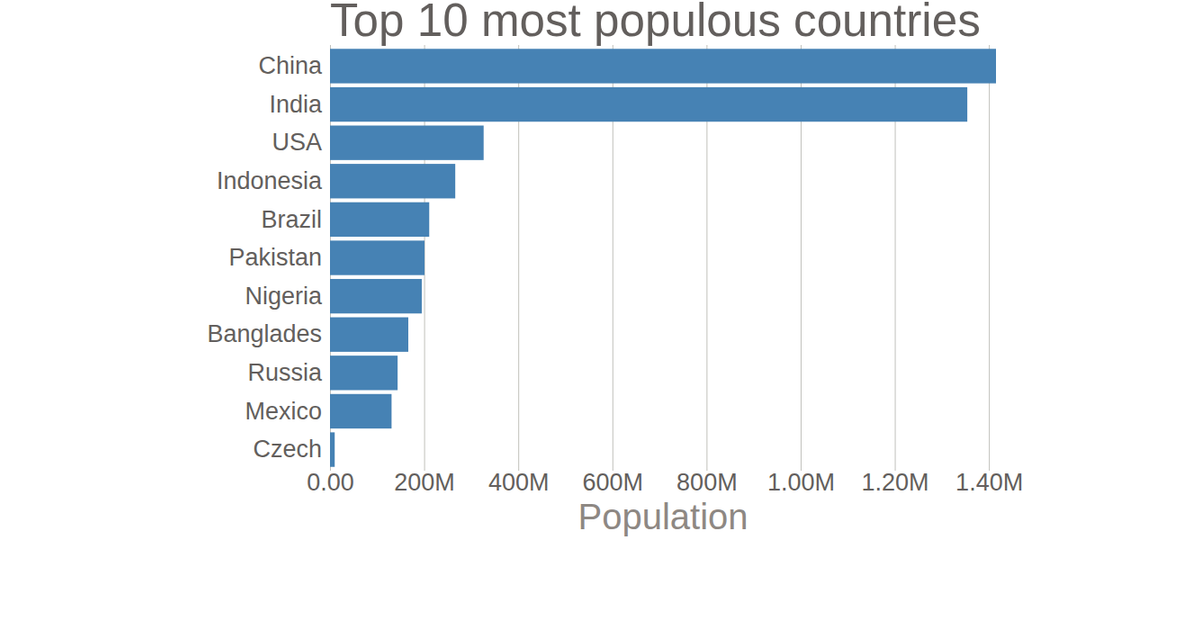
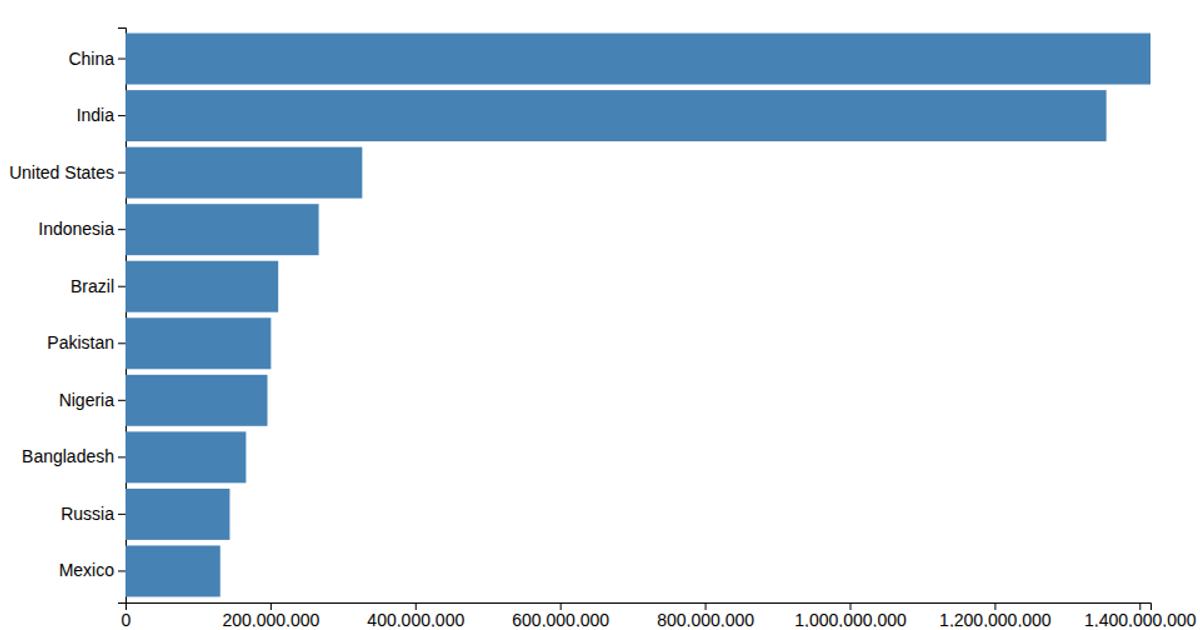
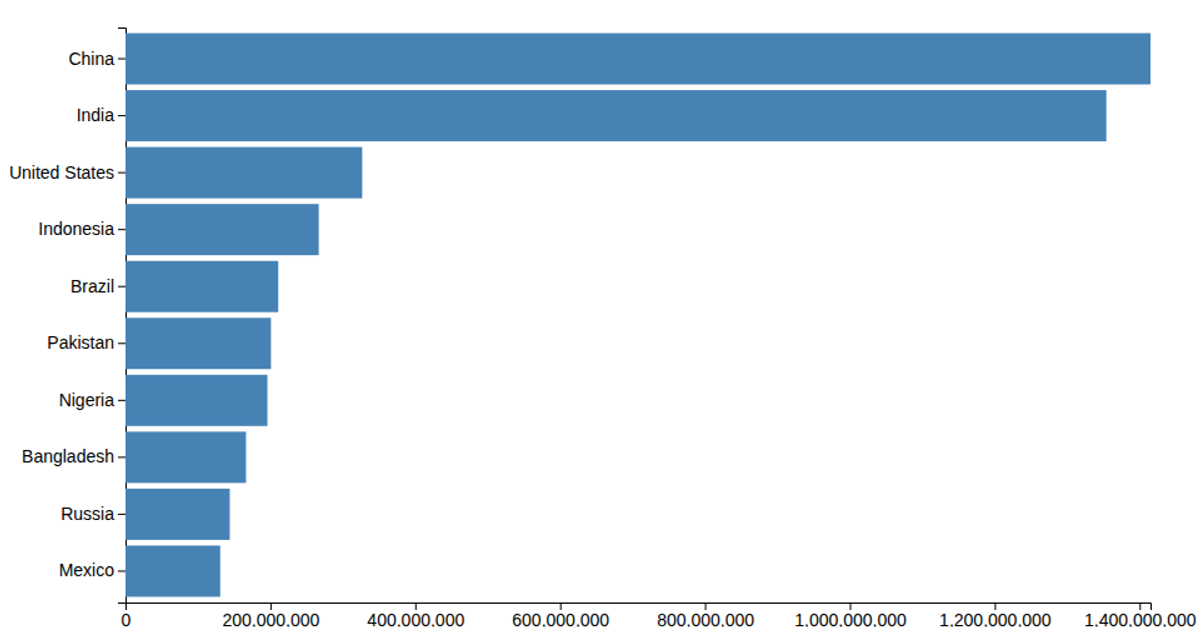
This example shows a bar chart of the population of ten countries, with labeled values on the x-axis and country names on the y-axis, rendered as SVG rectangles. Using D3 v5, the code loads data from the UN World Population 2017 dataset and applies a linear scale for population counts and a band scale for categorical countries. The chart draws its axes via `axisLeft` and `axisBottom`, and populates the graphic with a data join that appends `rect` elements.
AI-generated descriptionThis data comes from UN World Population 2017
MIT Licensed




Comments
Sign in to join the discussion.