🌍 Public
Activity 7.1
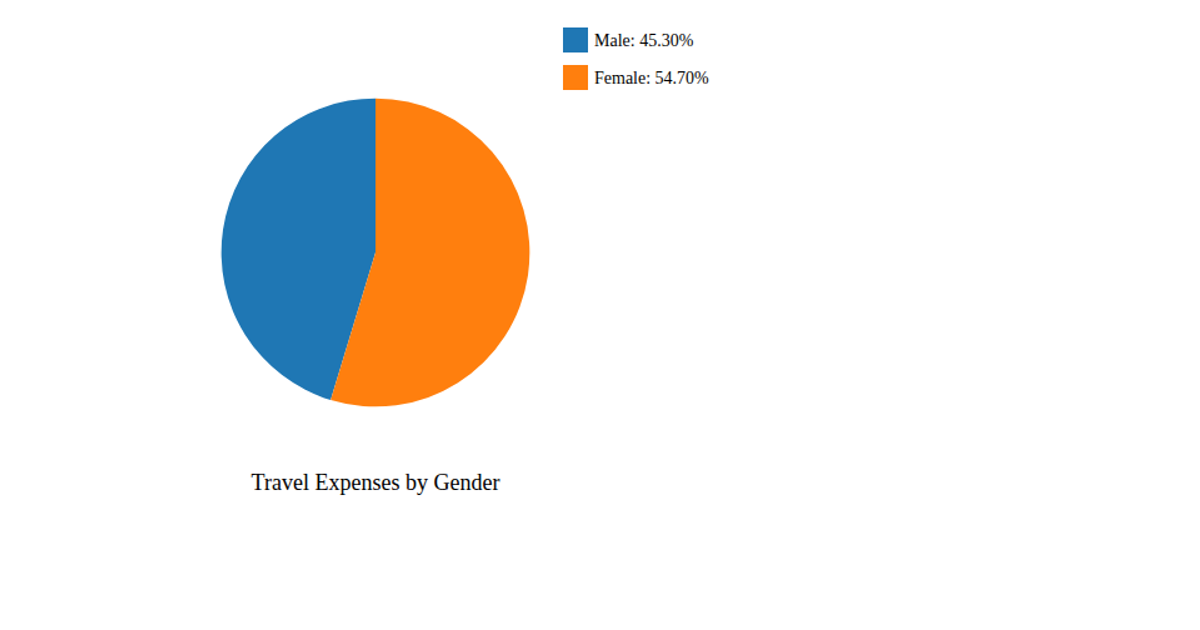
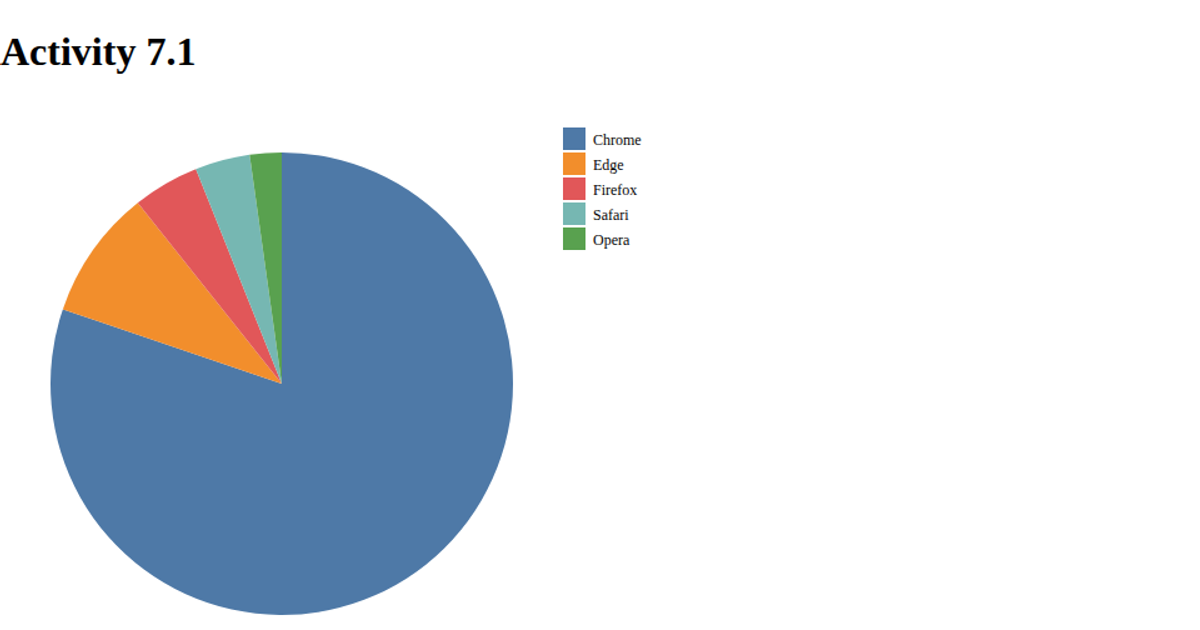
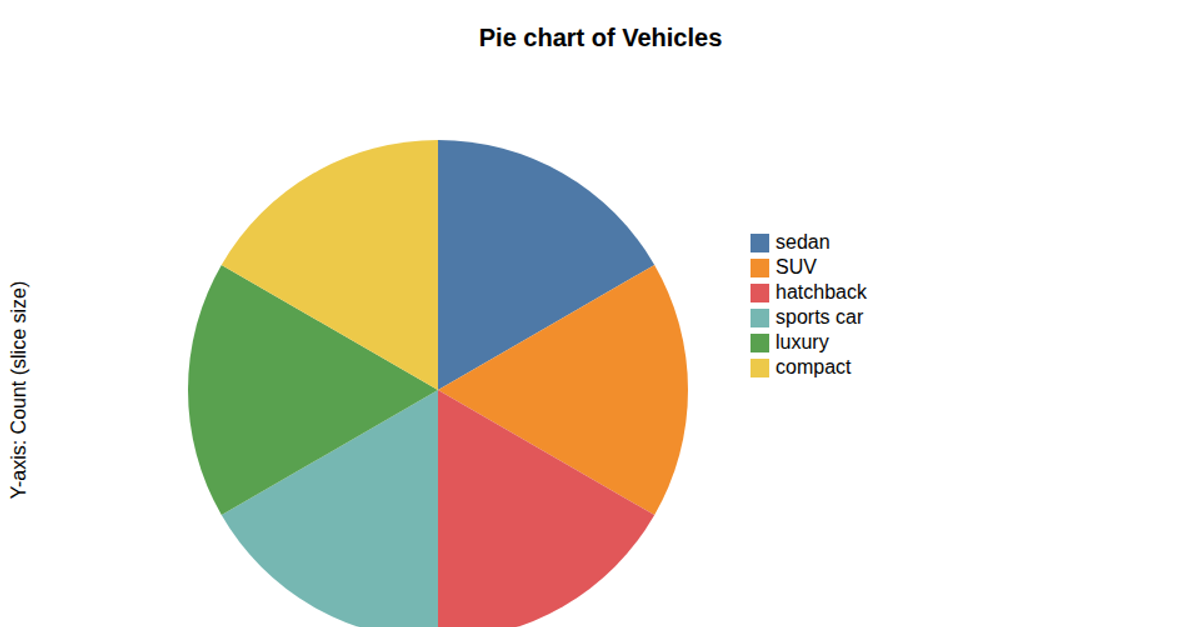
This pie chart visualizes the distribution of total counts across different travel modes from a CSV dataset. The data is loaded via `d3.csv` and aggregated by the 'Mode' column, with each slice's size proportional to its 'Total' value. The chart uses `d3.pie` and `d3.arc` to generate the arcs, which are rendered as SVG paths with a categorical color scale from `d3.scaleOrdinal`. A legend, built with the same color mapping, displays each mode and its corresponding total value alongside the chart.
AI-generated descriptionMIT Licensed




Comments
Sign in to join the discussion.