🌍 Public
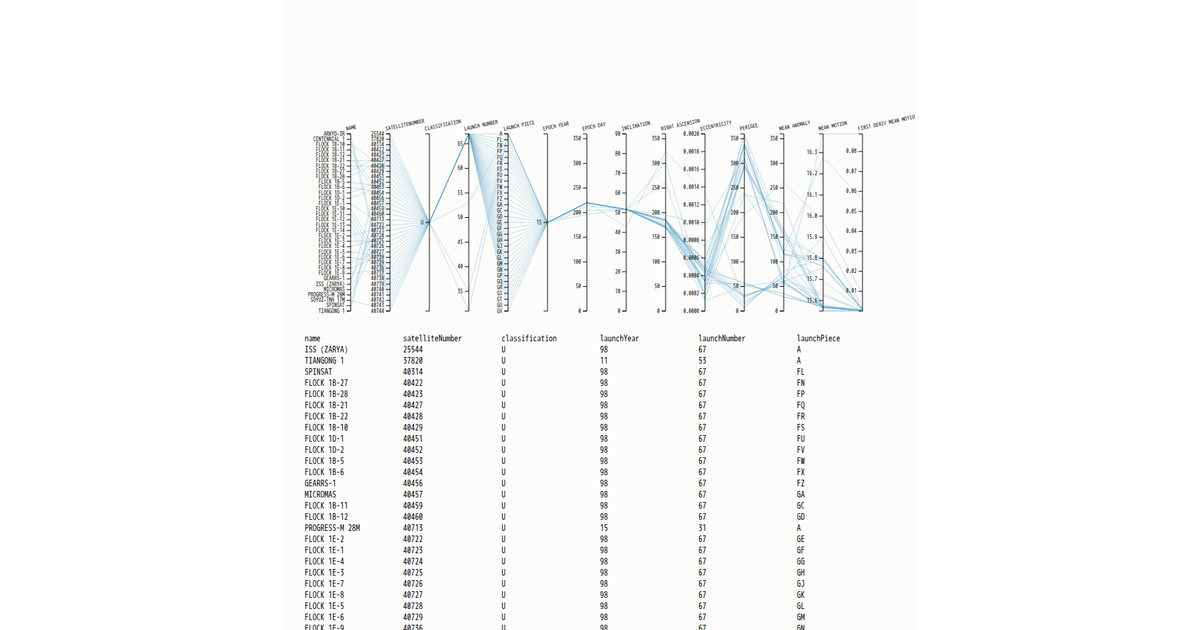
Space Stations_QN
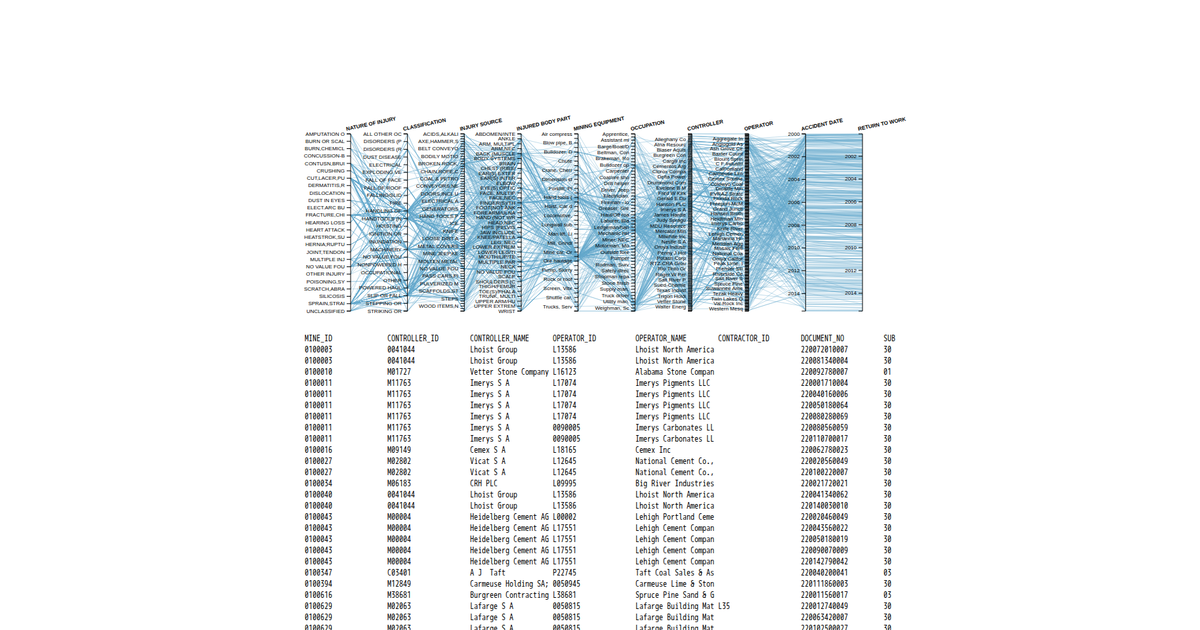
This parallel coordinates chart displays the attributes of subsea control module (SCM) notifications, with each axis representing a categorical field such as notification type, priority, origin, cause, damage description, material, and defect date. Each polyline traces a single record through the dimensions, revealing patterns and correlations across these variables. The visualization is built with D3.js (v3 and v5), using SVG for rendering and custom axes with brushes for interactive filtering. The data is loaded from a pipe-delimited text file containing 19 records of inspection and defect reports.
AI-generated descriptionMIT Licensed





Comments
Sign in to join the discussion.