🌍 Public
Fork of D3 Soccer Starter
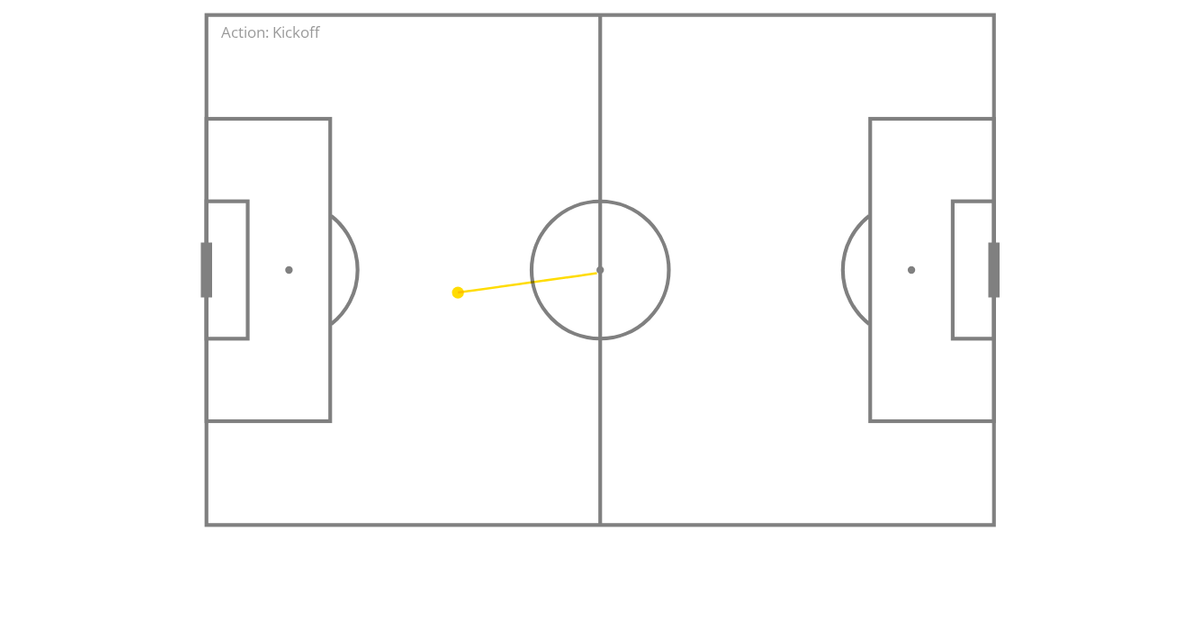
This visualization displays every shot taken during a Brazil–Belgium soccer match on a pitch diagram, with markers colored by outcome: green for successful goals, gray for failures, and red for own goals. Lines connect each shot’s start and end coordinates. Built with D3.js and the d3-soccer pitch component, it uses scaleLinear for coordinate mapping and scaleOrdinal for outcome colors. The underlying data includes player names and team information, presented via hover tooltips.
AI-generated descriptionISC Licensed







Comments
Sign in to join the discussion.