🌍 Public
Fork of Let's make a map with D3.js!
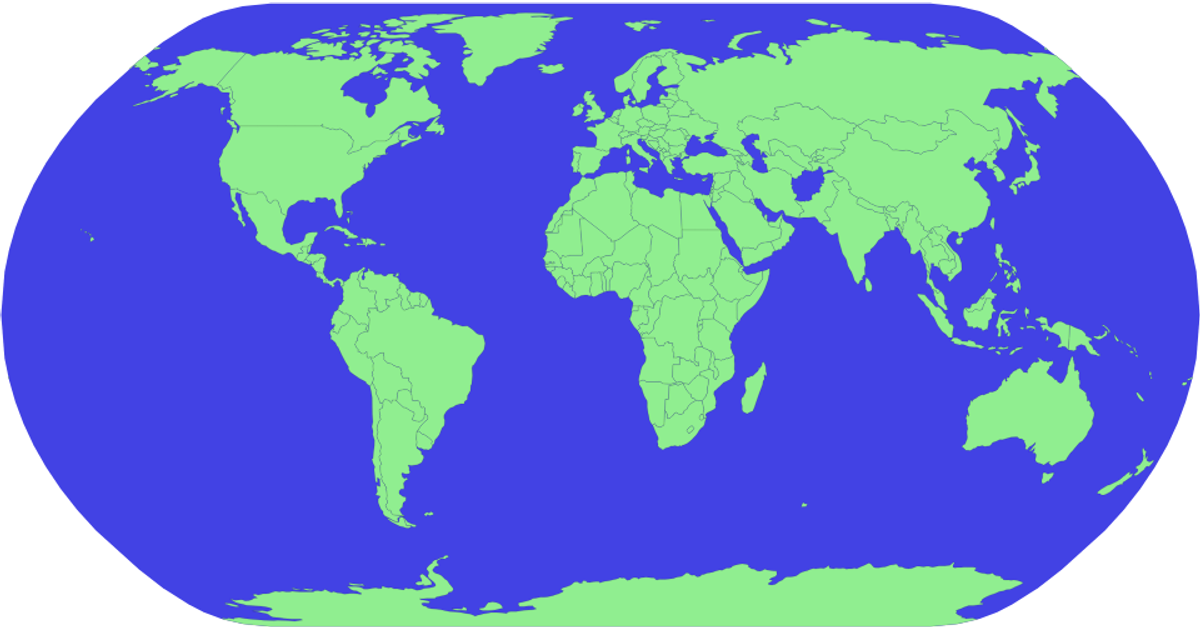
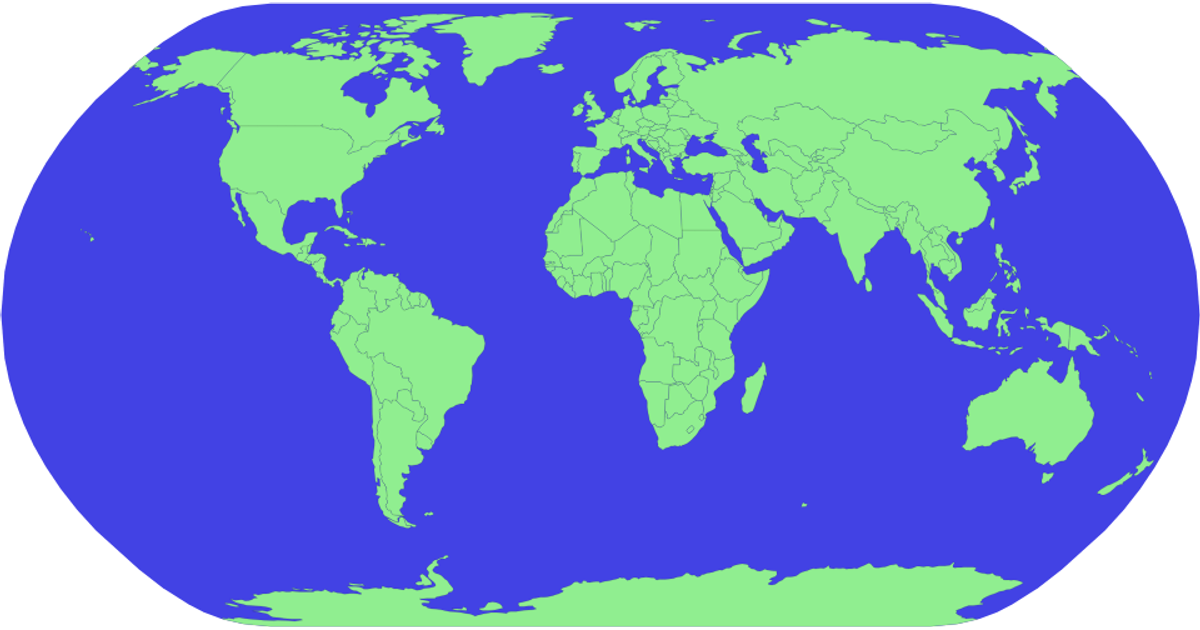
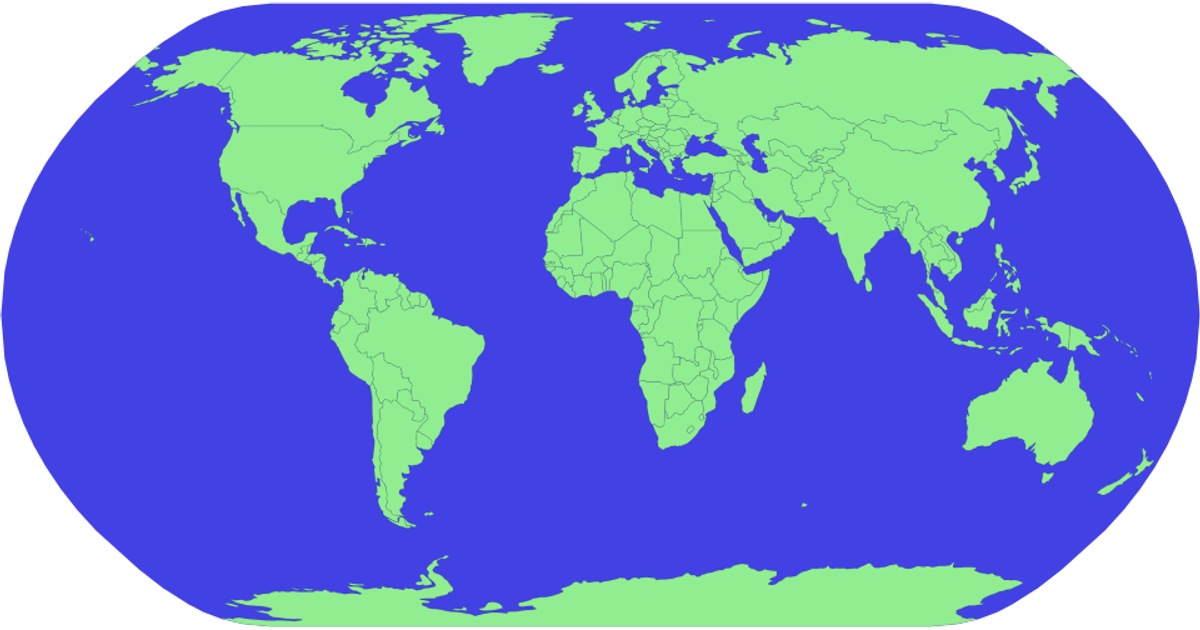
The visualization renders a geographic map of Brazil using D3.js v5 and TopoJSON, displaying state boundaries as light-green polygons with a blue sphere background. It loads geographic data from an external Gist URL via `d3.json`, then applies the `geoNaturalEarth1` projection and `geoPath` to generate SVG paths. While the code fetches and logs the data to the console, it does not yet draw the state shapes—only the sphere outline is visible. The example demonstrates a basic map setup using SVG rendering and asynchronous data loading.
AI-generated descriptionMIT Licensed




Comments
Sign in to join the discussion.