🌍 Public
ACTIVITY 6_TASK_4
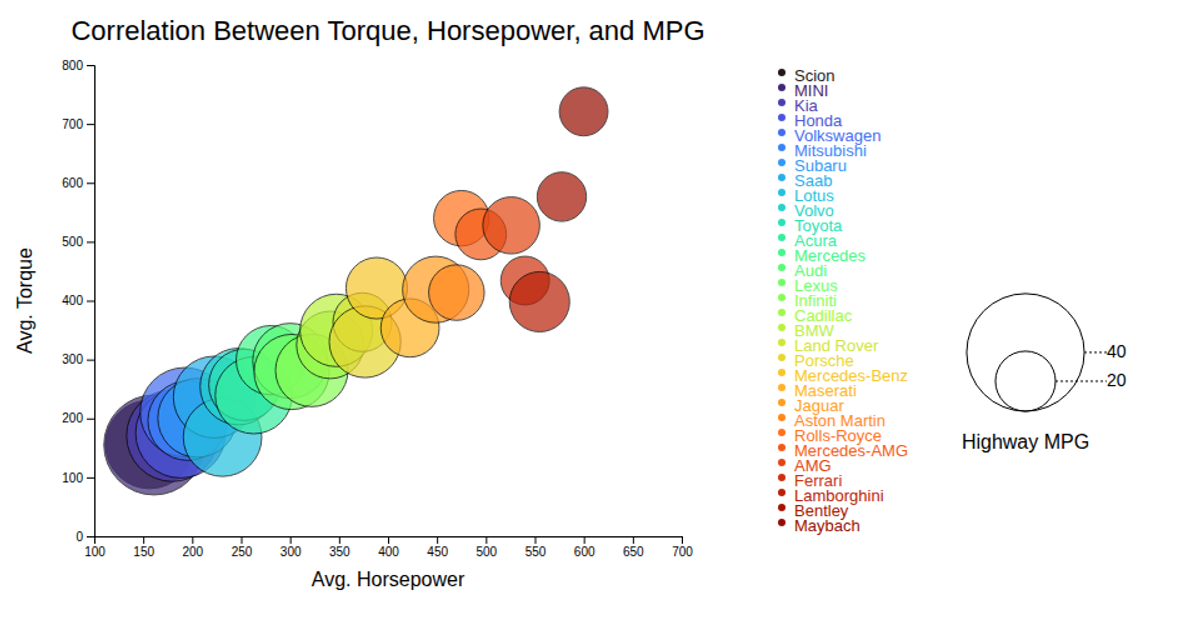
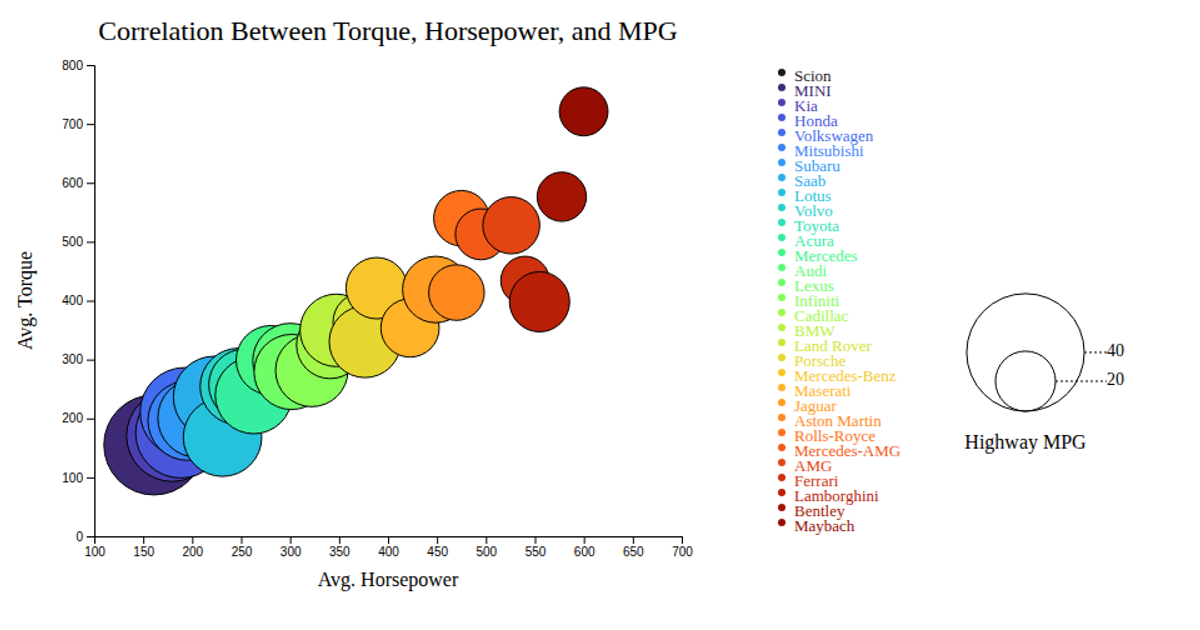
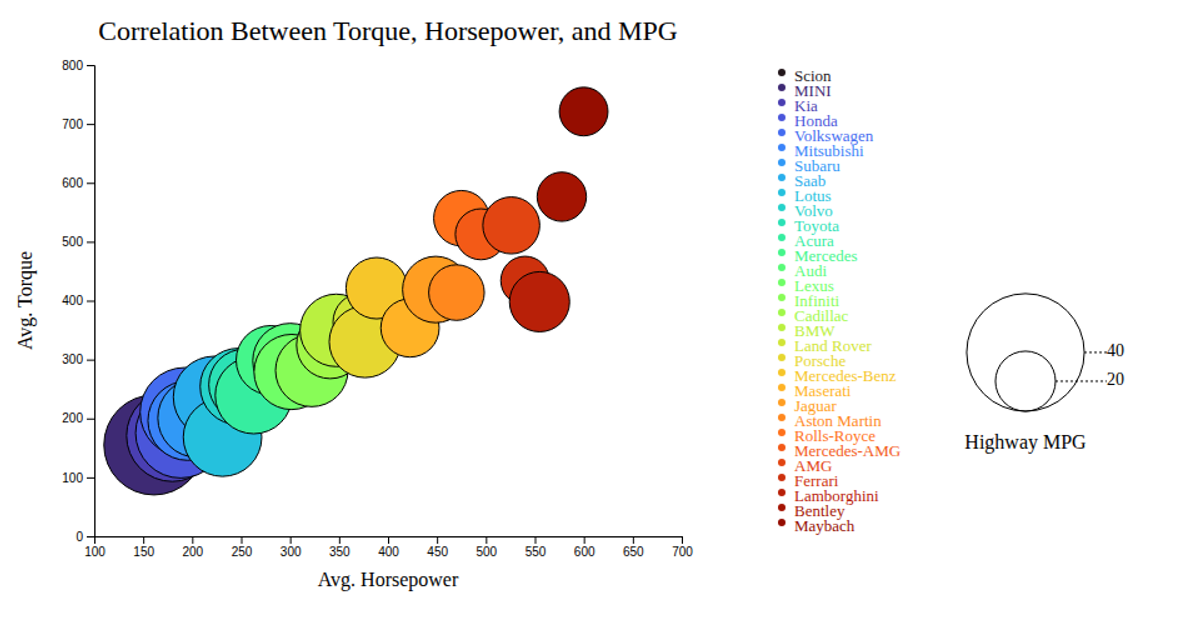
This bubble chart explores the correlation between a vehicle's average horsepower, torque, and highway MPG. The x-axis represents average horsepower, the y-axis shows average torque, and the size of each bubble encodes the highway MPG value. Data is sourced from a CSV file imported via `d3.csv`. The visualization uses `d3.scaleLinear` for axes and bubble size, and `d3.scaleOrdinal` for color mapping. Hovering a bubble triggers interactive tooltips, while a legend displays the bubble-size values.
AI-generated descriptionMIT Licensed





Comments
Sign in to join the discussion.