🌍 Public
Activity_6 Q_3
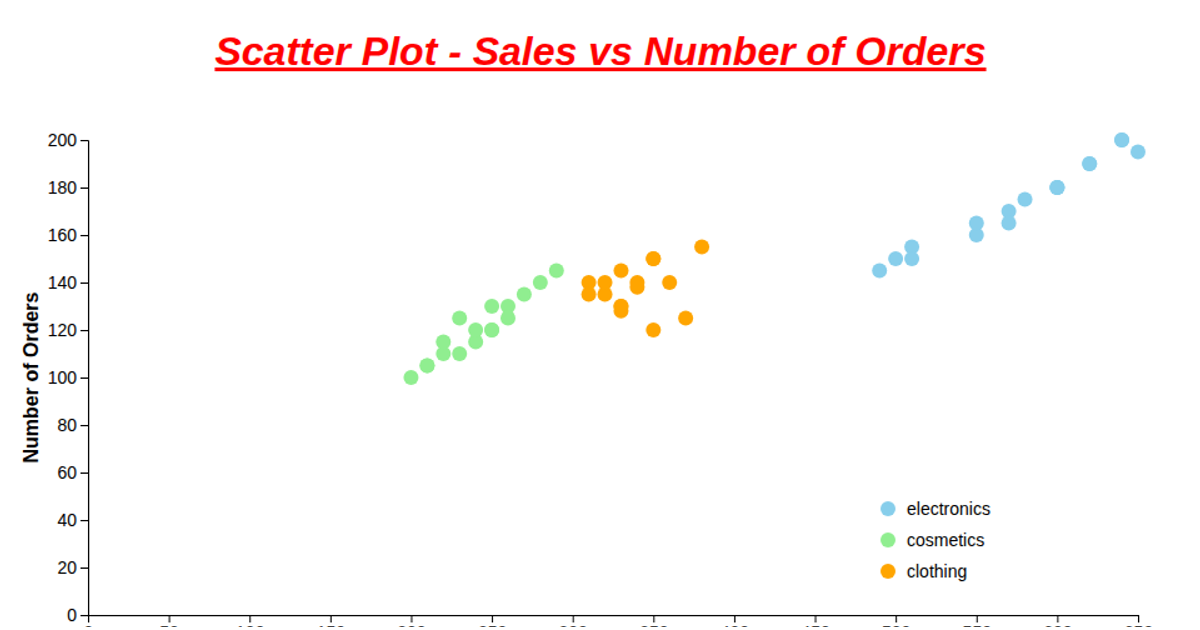
This visualization displays the relationship between chocolate products and their geographic markets using a categorical scatter plot. Each blue circle marks a combination of a product category and a geography, with the chart using rotated axis labels to accommodate the many product names. The visualization is built with D3 v6, loading CSV data from a GitHub repository and rendering to SVG. It defines ordinal scales for both axes using `d3.scaleBand()`, then positions circles at the intersection of each product-geography pair.
AI-generated descriptionMIT Licensed




Comments
Sign in to join the discussion.