🌍 Public
SVG Fundamentals
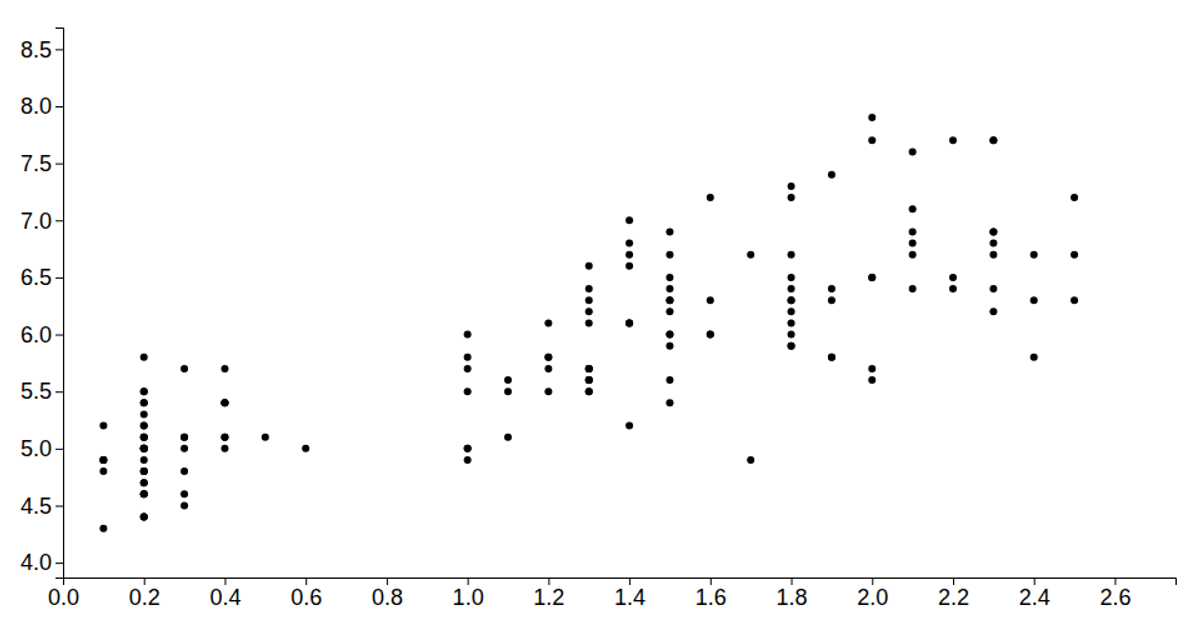
This example demonstrates a scatter plot of the Iris dataset, visualizing petal length against sepal length with different species represented by distinct symbols. The code constructs the visualization using D3 v6's `scaleLinear`, `extent`, `axisLeft`, and `axisBottom` APIs to compute scales and render axes, while `scaleOrdinal` and `symbol` generate the categorical glyphs. Data is loaded as CSV via `d3.csv`, and the plot is rendered as an SVG element into the document body, adapting to the full window size.
AI-generated descriptionA bare minimum HTML page demonstrating use of CSS and JavaScript.
See also React Starter.
MIT Licensed


Comments
Sign in to join the discussion.