🌍 Public
wine quality
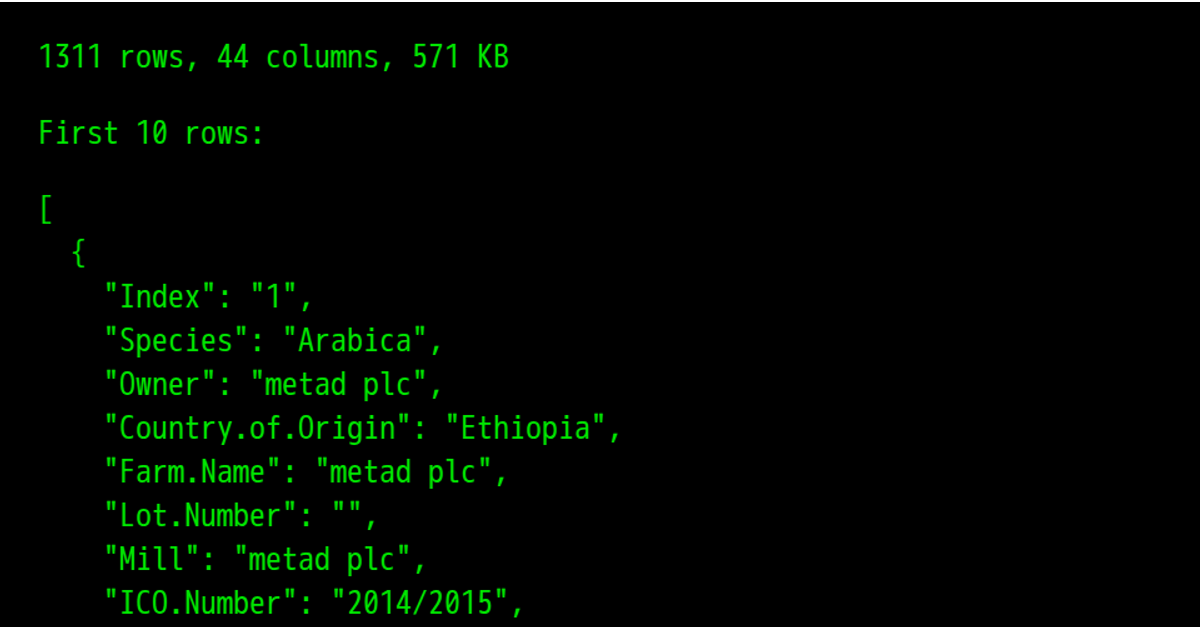
This visualization displays the first record of a coffee sales dataset, showing attributes such as date, payment type, card identifier, money amount, and coffee name. The code loads CSV data using a direct import, converts the money field from string to number, and renders the parsed JSON with a large font size in a preformatted block. It demonstrates basic data loading and inspection without any interactive or chart-based visualization.
AI-generated descriptionThe wine quality,
- I want to see the correlation between two attributes
- I want to understand the geographic distribution of an attribute
- I want to understand how an attribute changed by wine quality
- I want to be able to see the distribution of values
- I want to identify subsets of the data where an attribute
MIT Licensed




Comments
Sign in to join the discussion.