🌍 Public
Fork of Bar Chart to Mutli Stack Bar Chart
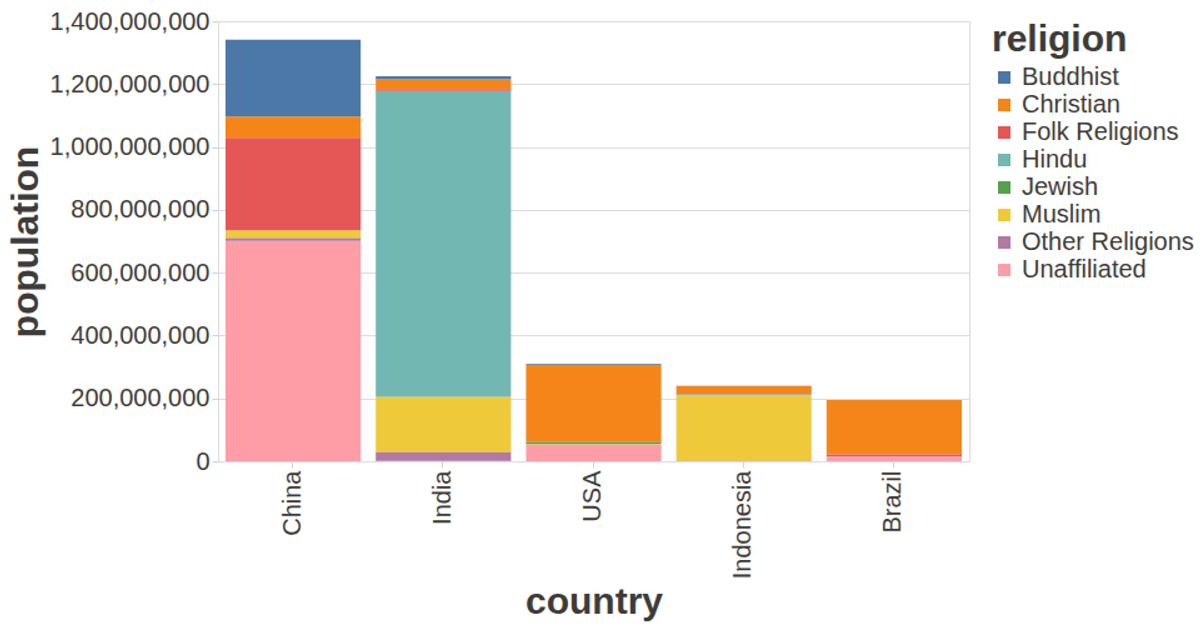
This example shows world population by country, broken down by religion, as a stacked bar chart. Each bar represents a country, with segments colored by religion and tooltips revealing the specific group. Using the vega-lite-api and vega-tooltip libraries, the visualization loads CSV data from a GitHub gist, renders with SVG, and applies custom styling for larger fonts and dark text. The bars are sorted by total population and sized via the `size` property for readability.
AI-generated descriptionA visualization constructed using the vega-lite-api.
MIT Licensed




Comments
Sign in to join the discussion.