🌍 Public
Fork of Axes with React & D3
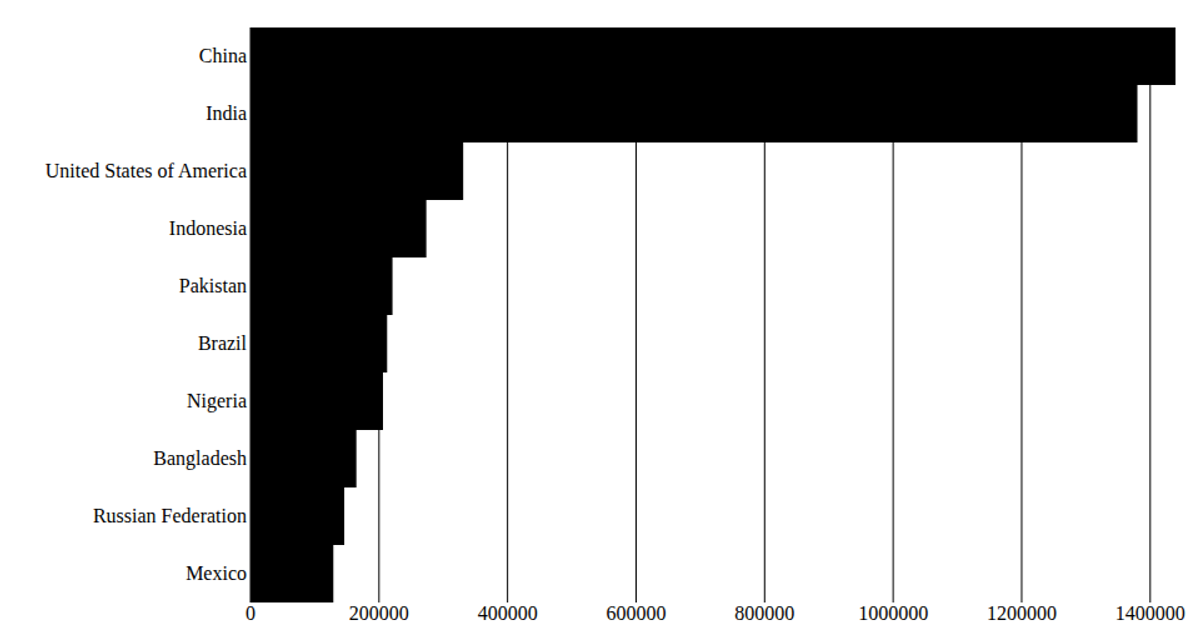
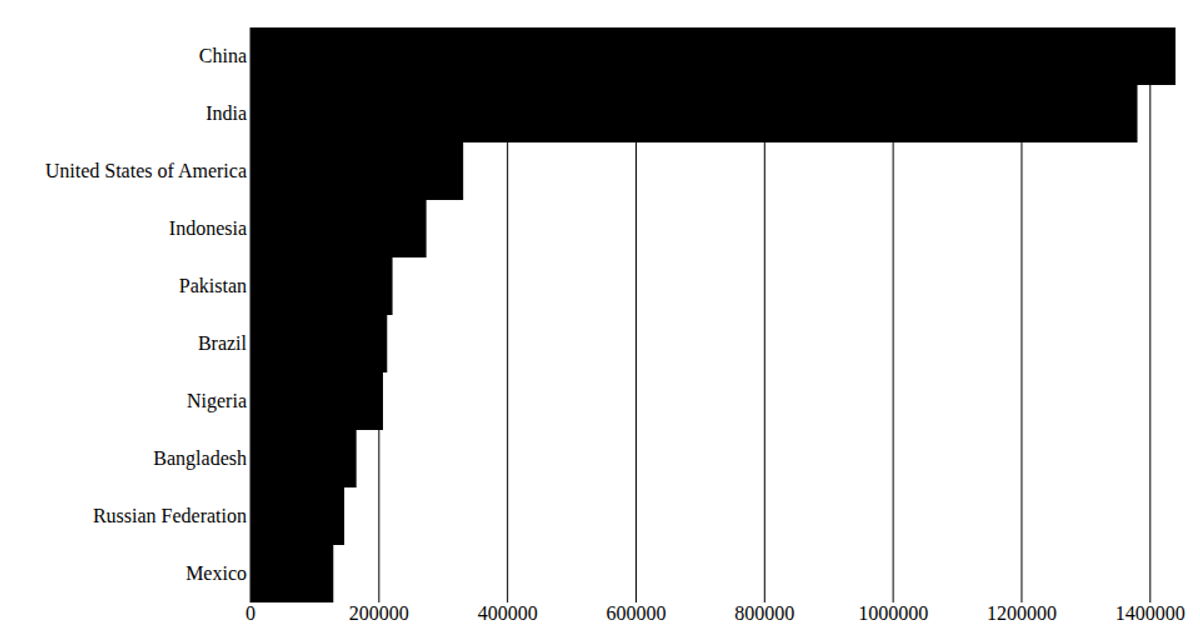
This visualization displays the top 10 most populous countries in 2020 as a bar chart, using the United Nations World Population Prospects 2019 dataset loaded via `d3.csv`. It renders as an SVG with React managing the component state, while D3 provides `scaleBand` for the categorical y-axis, `scaleLinear` for the numeric x-axis, and manual tick generation from `xScale.ticks()`. The chart includes grid lines and axis labels, but no axes components are used, showing a minimalist approach to chart construction.
AI-generated descriptionA program that shows the top 10 most populous countries as a pathetic bar chart with no axes.
MIT Licensed




Comments
Sign in to join the discussion.