🌍 Public
Choropleth - Dry Run
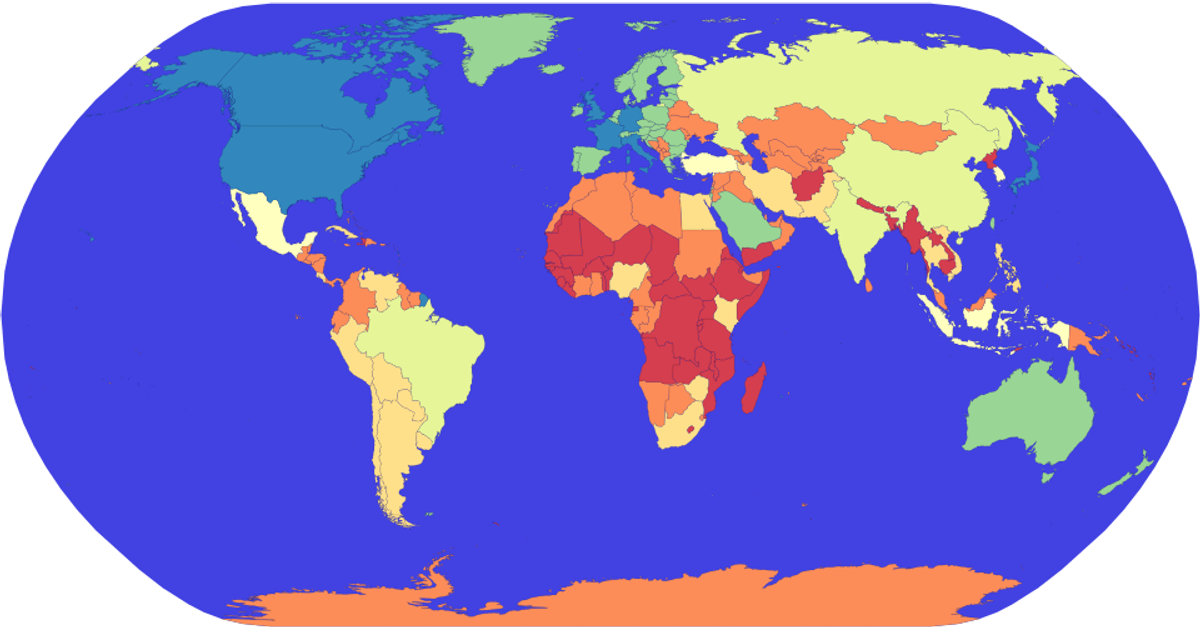
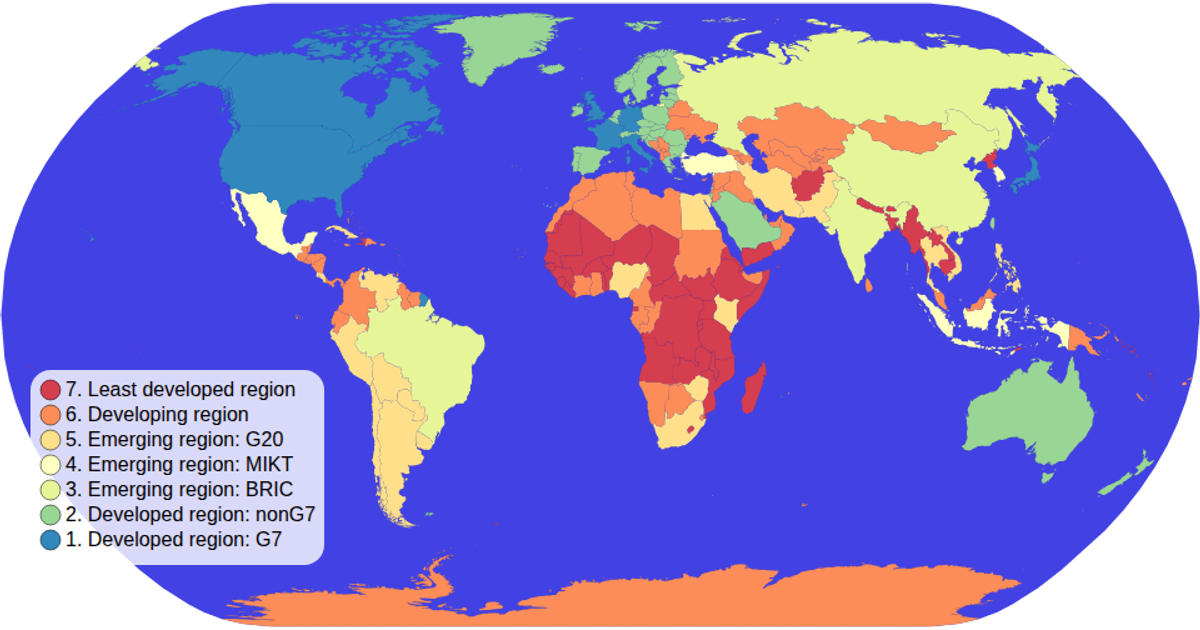
This example shows a world choropleth map where each country is colored according to its economic classification, with a tooltip revealing the country name on hover. The map uses a natural Earth projection and supports pan and zoom interactions. It loads world geometry as TopoJSON and country metadata as TSV from the world-atlas package, then renders the countries as SVG paths using d3.geoPath and colors them with d3.scaleOrdinal based on the `economy` property.
AI-generated descriptionMIT Licensed



Comments
Sign in to join the discussion.