🌍 Public
Shapes with SVG and CSS
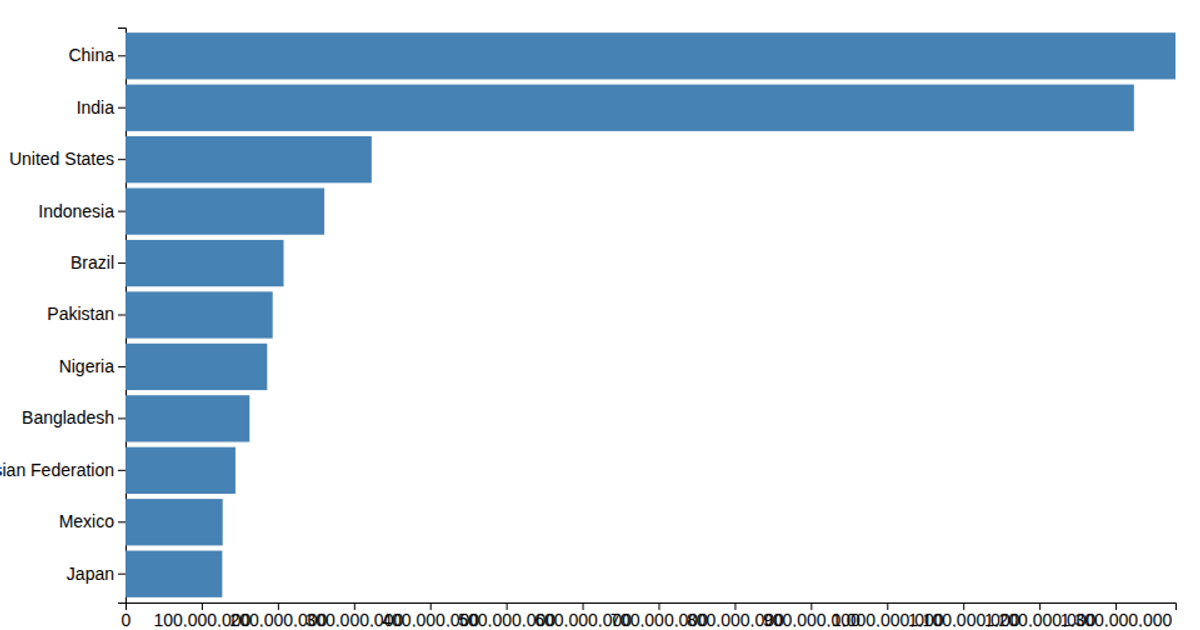
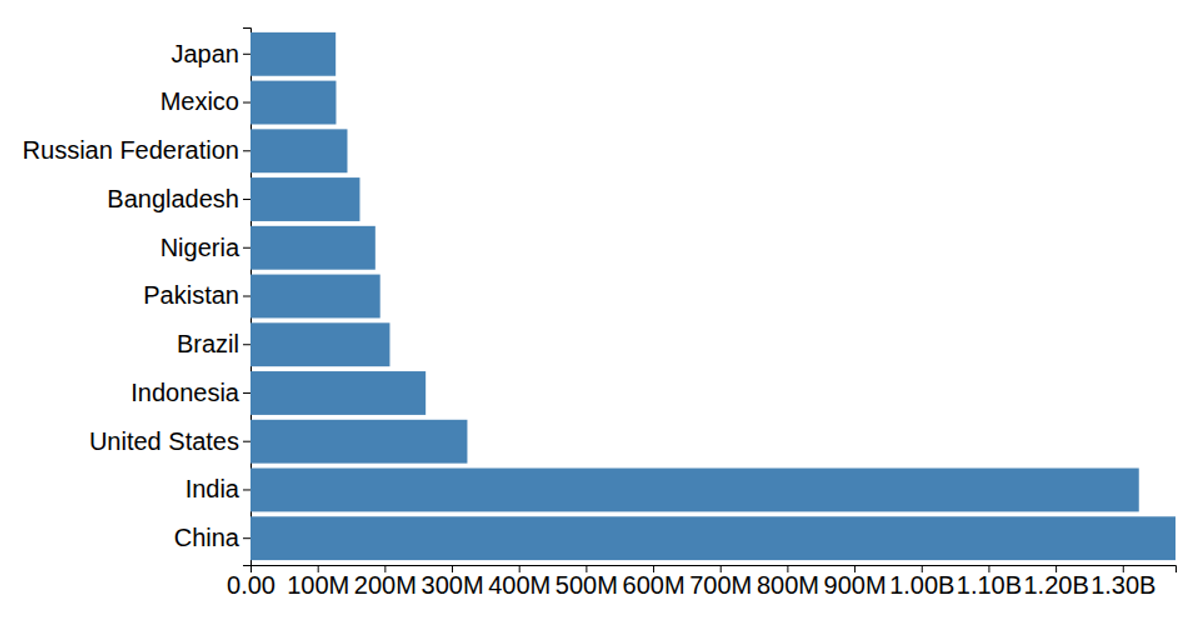
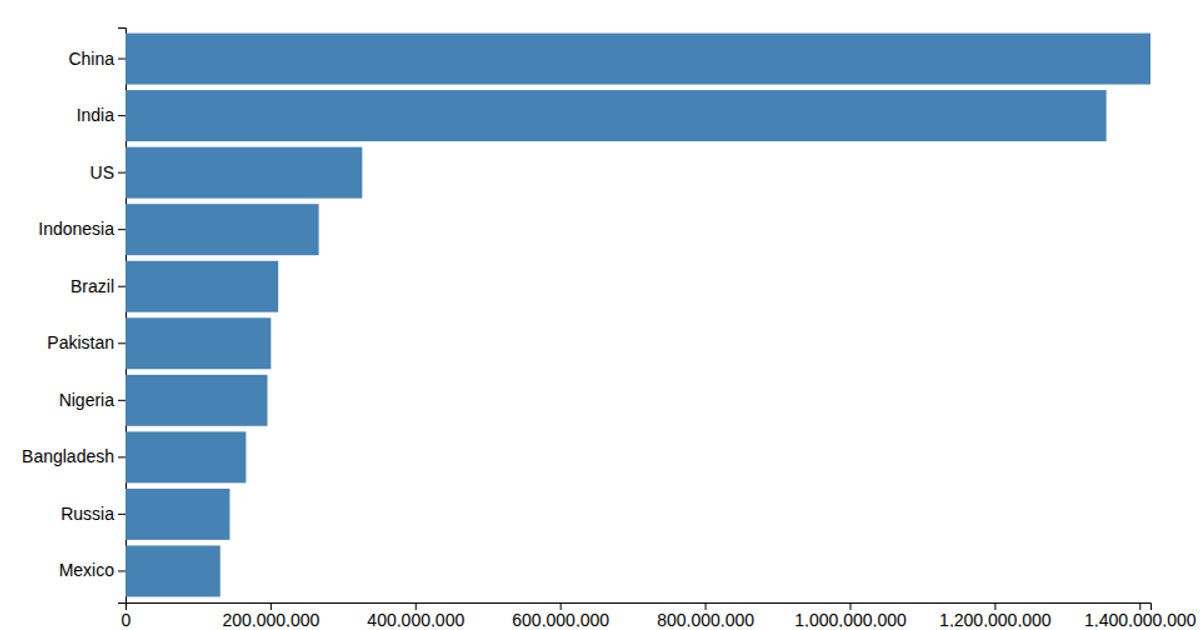
This bar chart displays population estimates for ten countries from a supplied CSV, ranking them from largest to smallest. Built with D3 v5, it uses `scaleLinear` for the x-axis and `scaleBand` for y-axis categories, with `axisLeft` and `axisBottom` for ticks. Rectangles are styled with a steelblue fill via CSS.
AI-generated descriptionMIT Licensed





Comments
Sign in to join the discussion.