🌍 Public
VegaLite 1
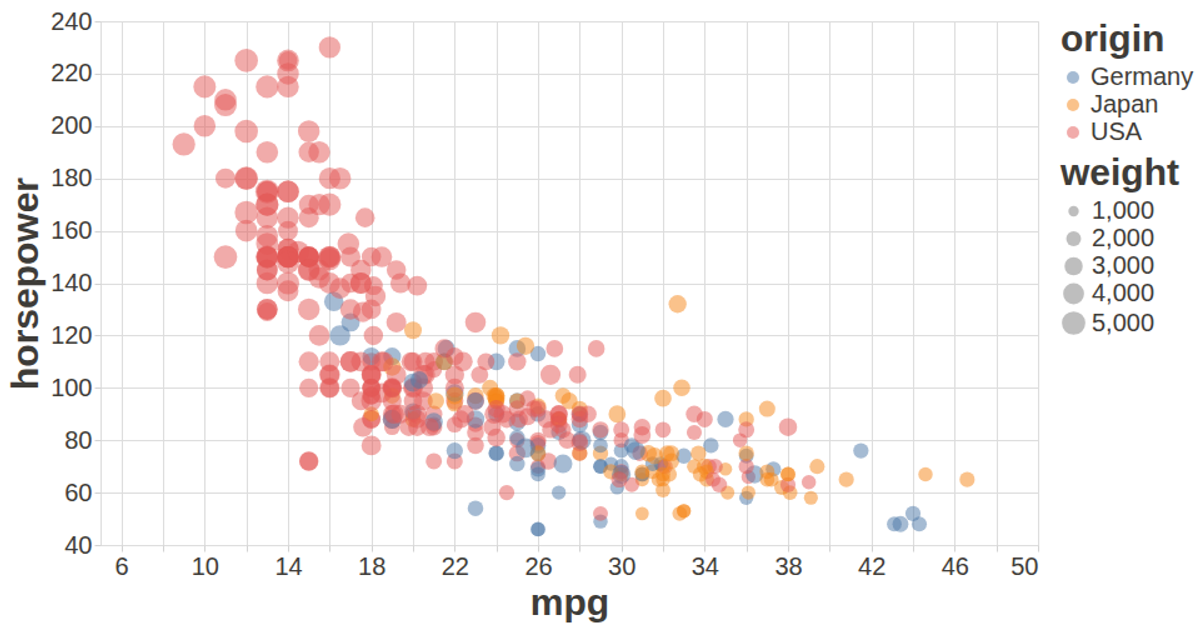
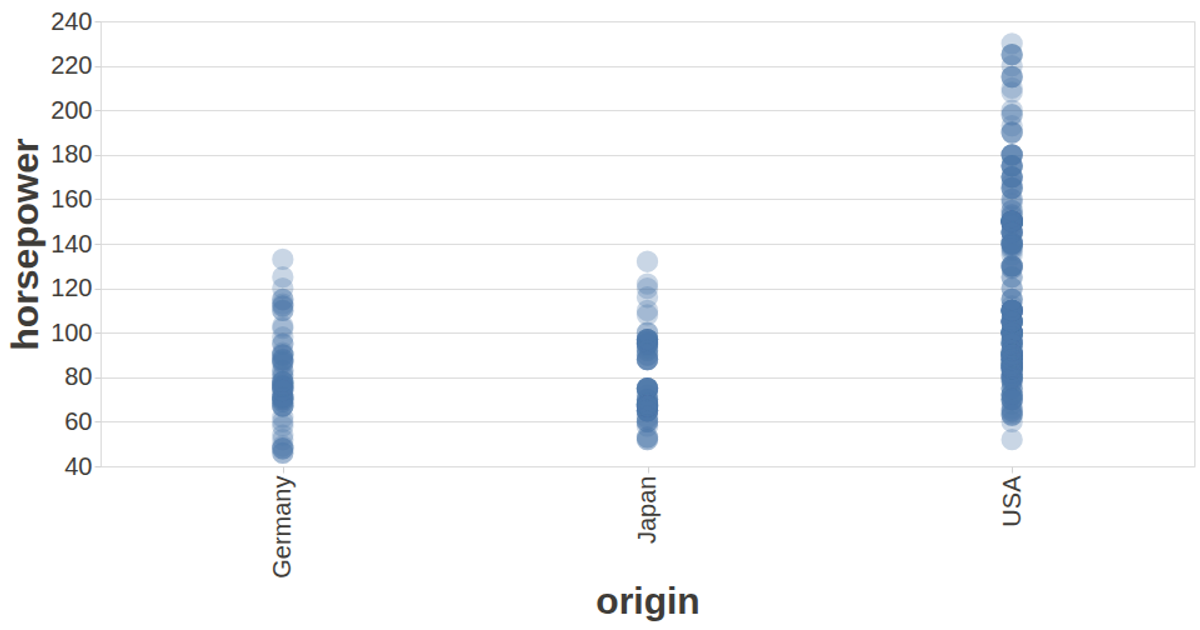
This interactive scatterplot uses the Vega-Lite API to explore the UCI Auto MPG dataset, plotting car origin against cylinders. Points are colored by origin, sized by weight, and display the car name on hover via a tooltip. The visualization is built with `vega-lite-api` and `vega-lite`, rendering to SVG with a customized dark theme and responsive sizing to fill the browser window.
AI-generated descriptionA visualization constructed using the vega-lite-api.
The data shown here comes from the UCI Machine Learning Repository: Auto MPG Data Set, via Gist: Scatter Plot with Menus.
MIT Licensed




Comments
Sign in to join the discussion.