🌍 Public
Tutorial Sunburst Datavisualisation
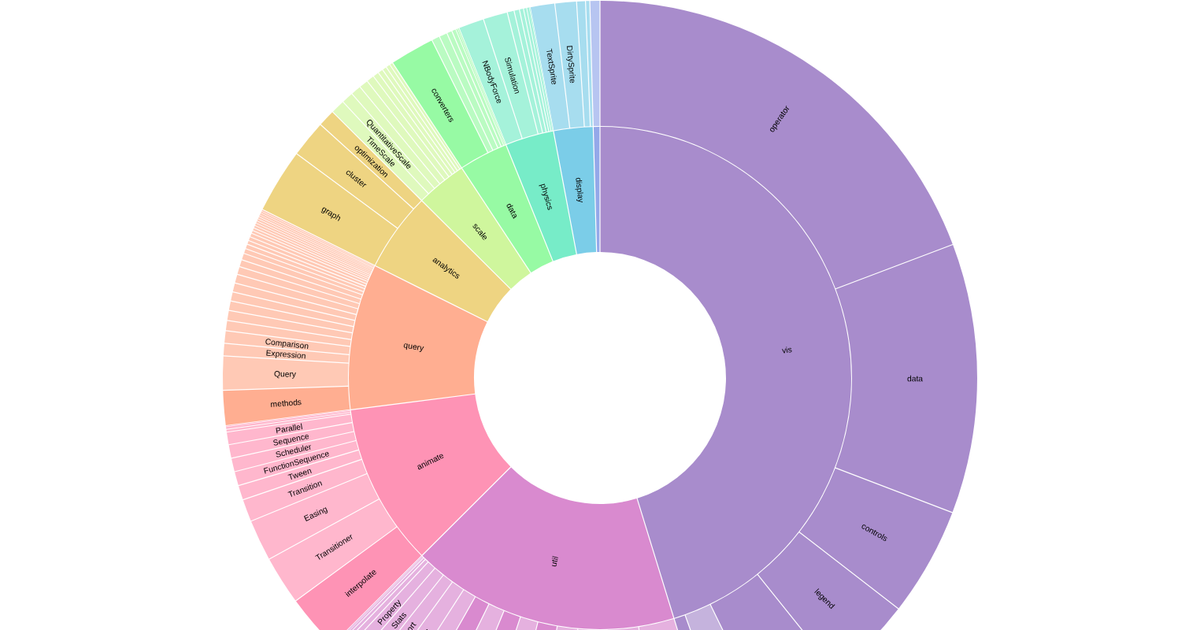
This sunburst chart visualizes a categorical dataset of weapon types, showing hierarchical proportions through concentric arcs. The D3.js v4 code uses `d3.partition` and `d3.arc` with a `d3.hierarchy` structure, rendered as SVG paths from a sample dataset defining topics and sub-items. A dark background provides contrast for the color-coded segments. The example primarily demonstrates how to construct a sunburst layout programmatically rather than displaying the full provided data.
AI-generated descriptionAn example showing the capabilities of VizHub.
MIT Licensed



Comments
Sign in to join the discussion.