🌍 Public
Interactive World Map
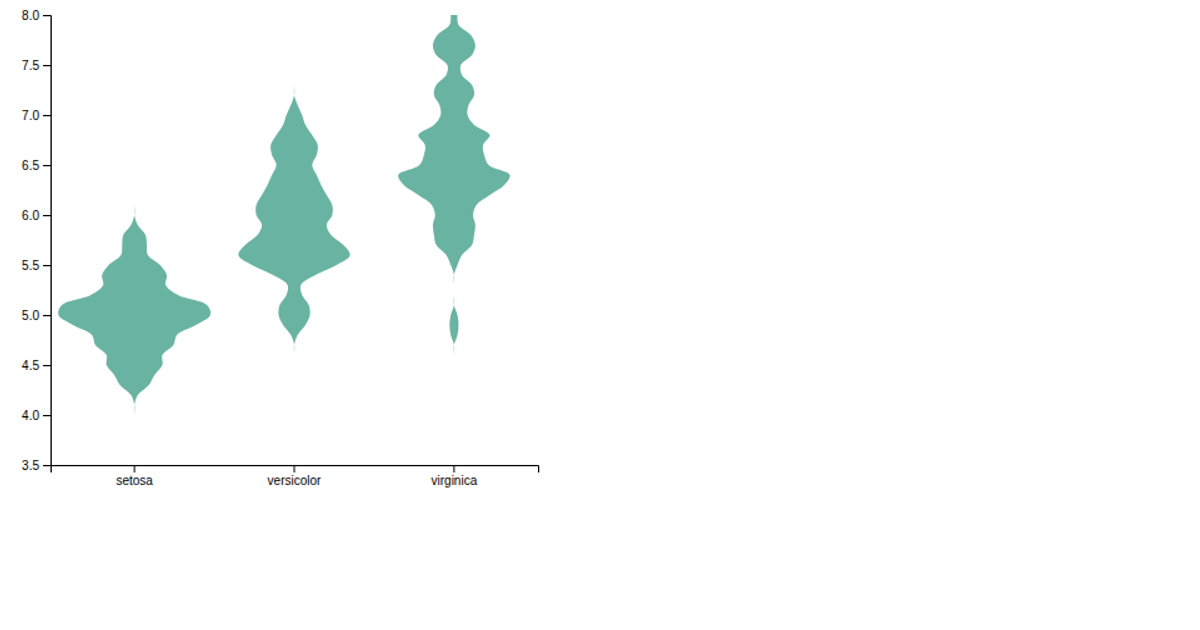
This interactive visualization displays kernel density estimates of iris sepal length distributions for three iris species, with a dropdown menu to switch between species. The d3.js code loads data from a CSV file, computes density curves using kernel density estimation, and renders them as smooth SVG paths. A transition animates the curve when a new species is selected.
AI-generated descriptionA bare minimum HTML page demonstrating use of CSS and JavaScript.
See also React Starter.
MIT Licensed






Comments
Sign in to join the discussion.