🌍 Public
Rendering Data (part 2) with React
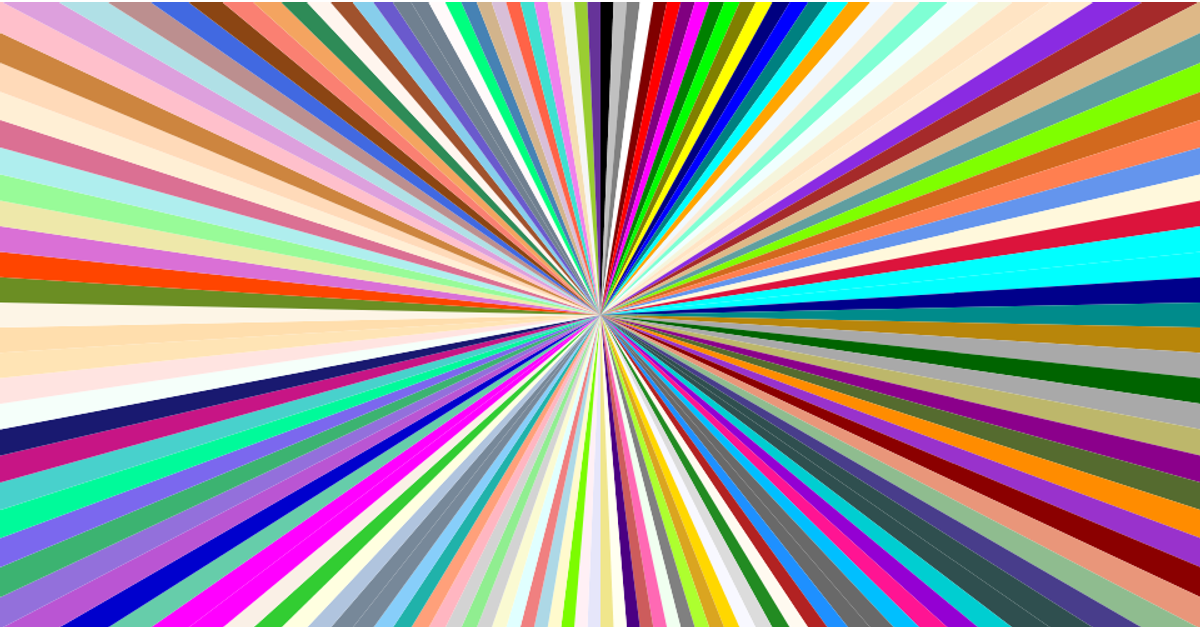
A radial burst of CSS named colors is rendered in an SVG, with each color occupying an equal arc. The example shows how React state manages asynchronous data loading while D3 utilities process and visualize it. The code uses `d3.csv` to fetch color data, `d3.pie` to compute angles, and `d3.arc` to generate path shapes, all within a React component using hooks like `useState` and `useEffect`.
AI-generated descriptionA program to read in data about CSS named colors using D3 utilities and then uses React STATE to render the data as a radial burst
MIT Licensed




Comments
Sign in to join the discussion.