🌍 Public
line
Ssaiyogesh9911@gmail.com
Last edited Mar 27, 2024
Created on Mar 27, 2024
Forked from Brain and CNS Cancer Mortality Rate in UK
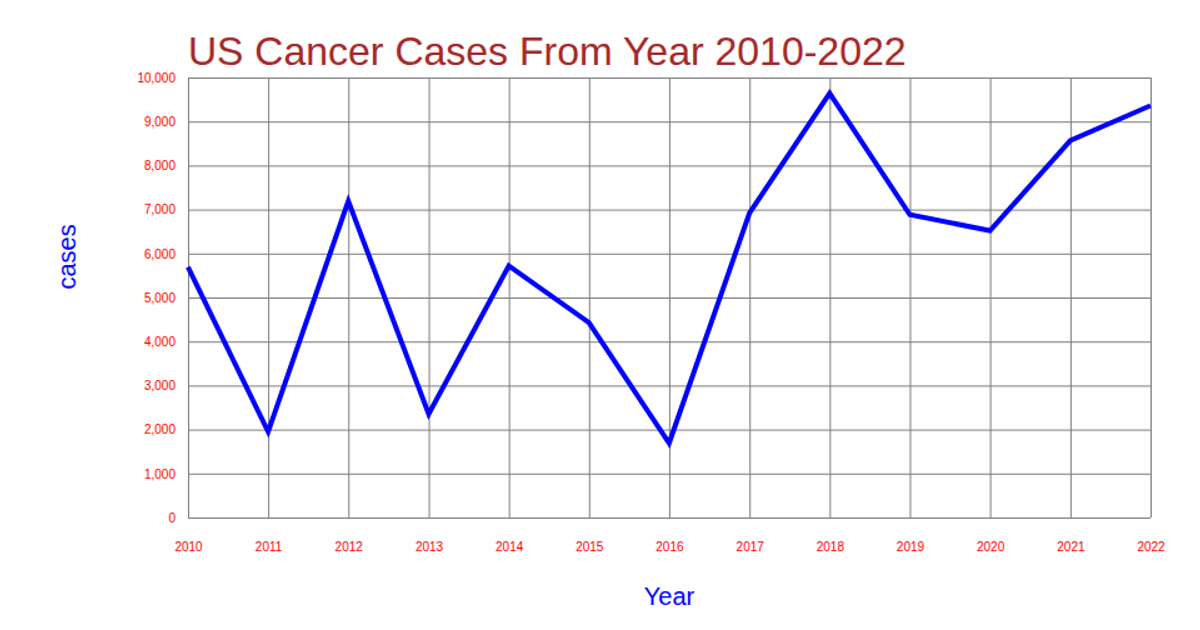
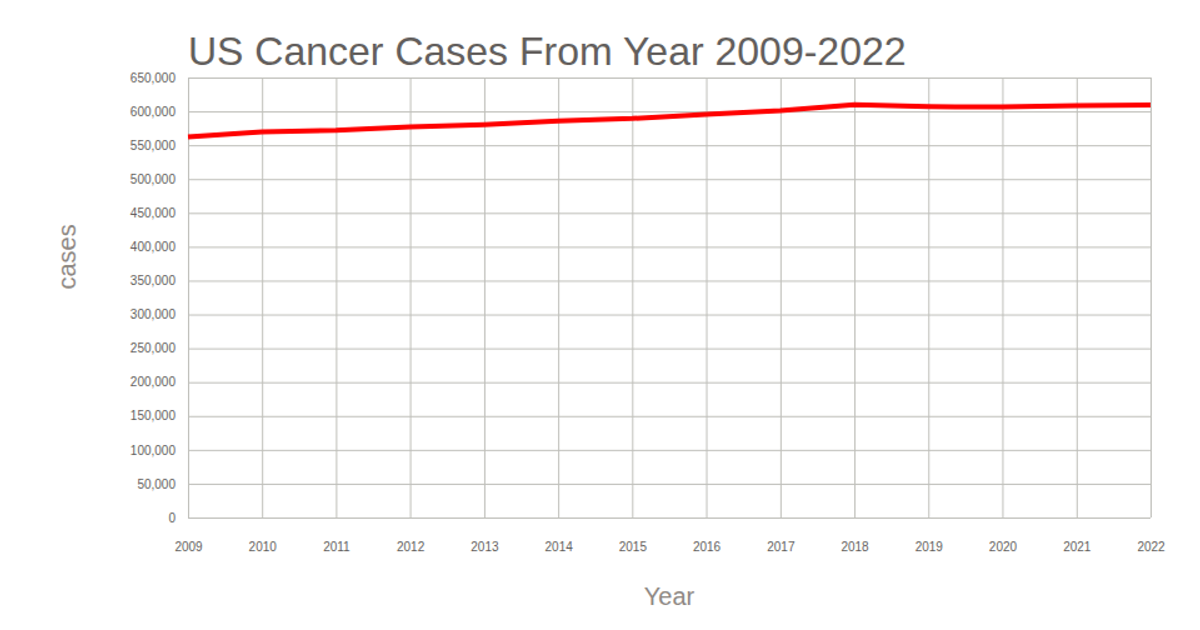
This example shows the trend of brain and CNS cancer cases over time as a line chart, with data loaded from a CSV file. The visualization uses D3 v7 to create SVG-based axes with gridlines, mapping years to the x-axis and cancer case counts to the y-axis. The line generator, scales, and axis functions from D3 are used to draw the chart, while the dataset is parsed and mapped to the expected columns before rendering.
AI-generated descriptionA bare minimum HTML page demonstrating use of CSS and JavaScript.
See also React Starter.
MIT Licensed




Comments
Sign in to join the discussion.