🌍 Public
Pie chart For Milk Production
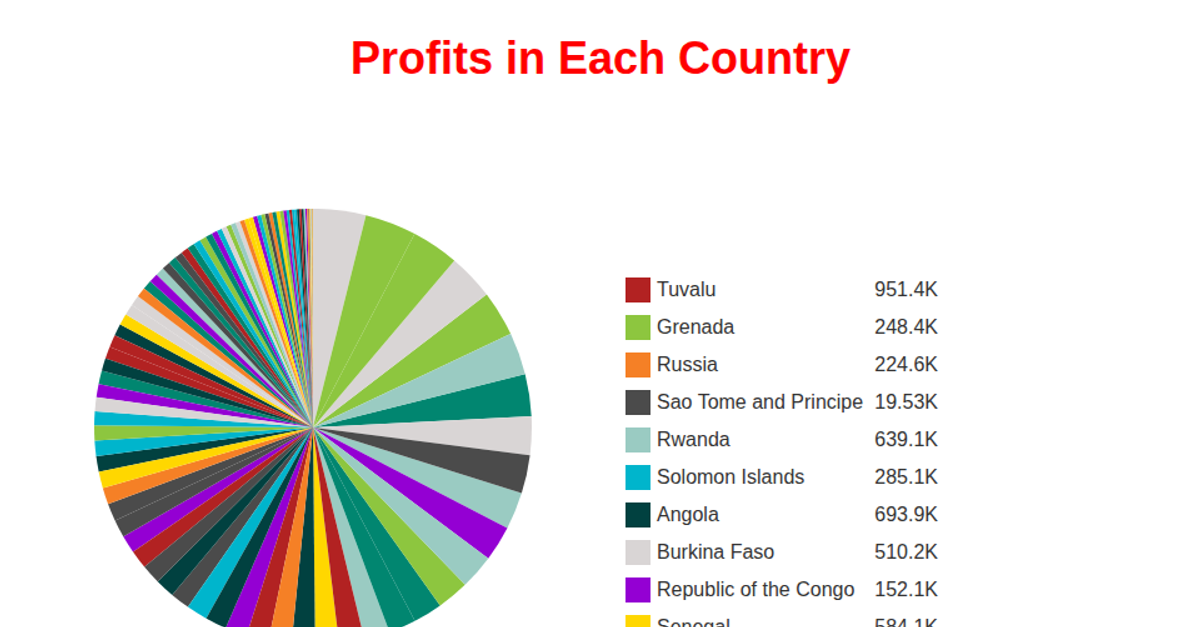
The pie chart visualizes milk production across various countries, showing each country’s proportional contribution with labeled slices and a hover tooltip that displays the percentage of total production. The chart is rendered in SVG using D3.js, with data fetched from a GitHub-hosted CSV file via `d3.csv`. It employs `d3.pie()` for angle computation, `d3.arc()` for slice geometry, and `d3.scaleOrdinal()` with a custom color range. Tooltips appear on mouseover, and the visualization uses `d3.select` for DOM manipulation and event handling.
AI-generated descriptionMIT Licensed




Comments
Sign in to join the discussion.