🌍 Public
map.js
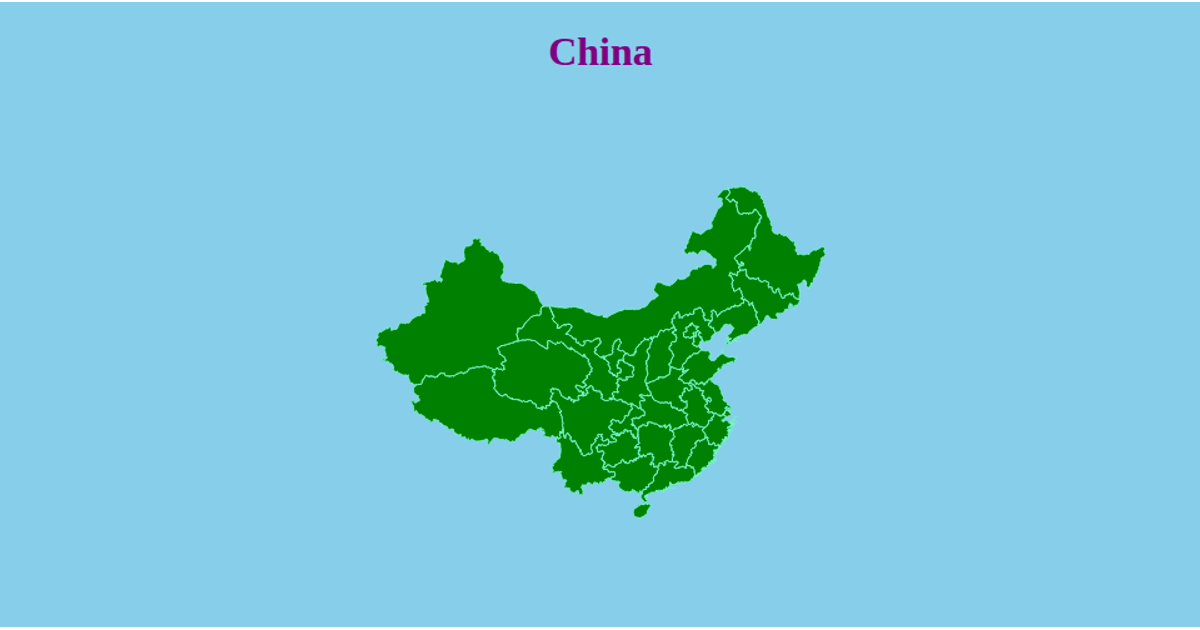
This visualization shows the cumulative growth of China’s protected geographical indication products from 2003 to 2010. A choropleth map fills each province by the number of products registered up to a selected year, while a bubble map overlays proportional circles at province centroids. An interactive slider updates the year, and radio buttons switch between the two views. The code uses d3.json to load GeoJSON, d3.geoPath and d3.geoMercator for map rendering, d3.scaleThreshold and d3.scaleSqrt for color and size encoding, and d3.zoom for panning and zooming.
AI-generated descriptionMIT Licensed




Comments
Sign in to join the discussion.