🌍 Public
USA Death vs time
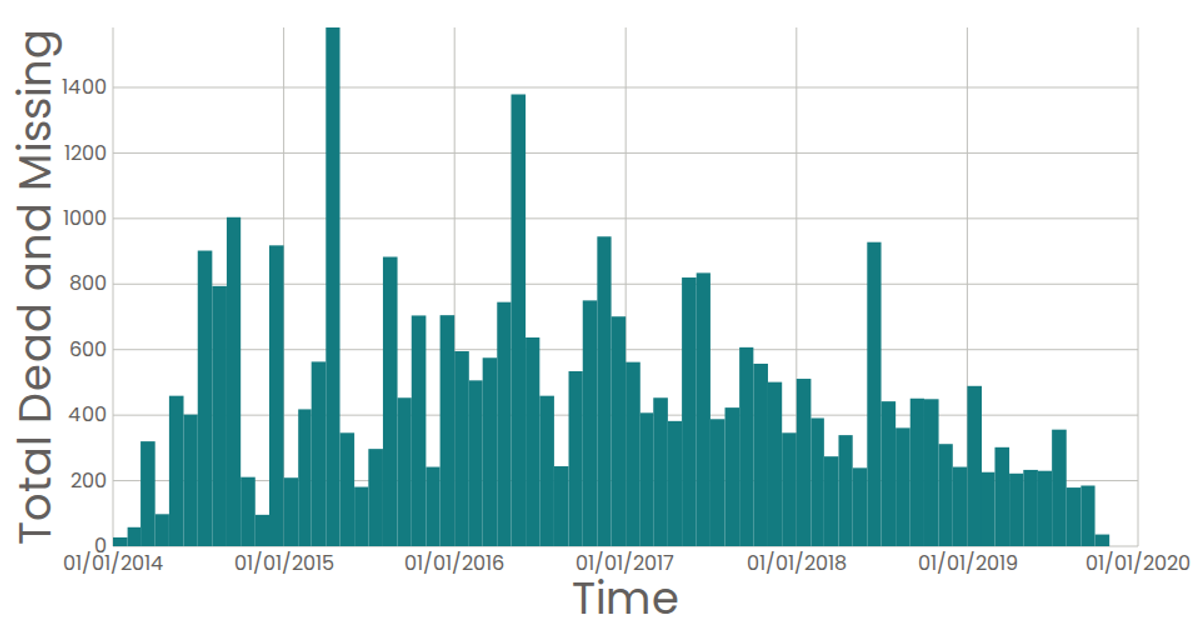
This example visualizes the total number of dead and missing migrants per month using a date histogram, highlighting the peak month in red. It employs D3's `scaleTime`, `scaleLinear`, `histogram` (via `d3.bin`), and `sum` functions to bin and aggregate data from the Missing Migrants Dataset. The rendering uses React with SVG, featuring interactive hover tooltips and zoom functionality through D3's `zoom` behavior. Axes are drawn with custom `AxisBottom` and `AxisLeft` components.
AI-generated descriptionA date histogram showing the sum total dead and missing migrants for each month.
Data from the Missing Migrants Dataset.
MIT Licensed


Comments
Sign in to join the discussion.