🌍 Public
Fork of Fork of Fork of Activity 6
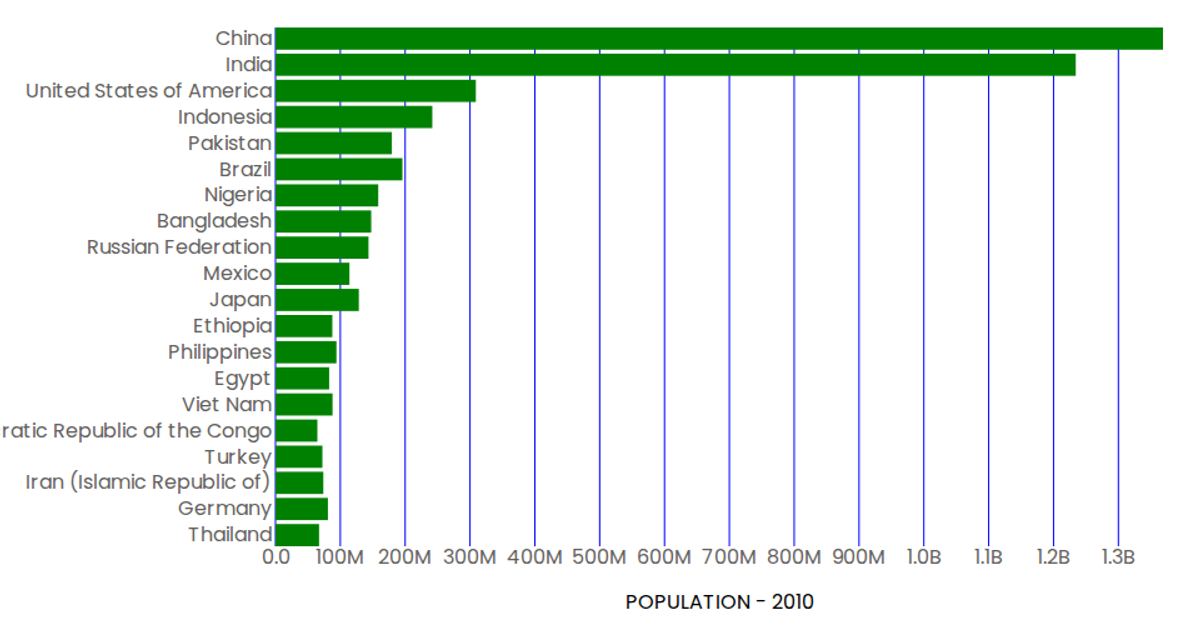
This interactive bar chart displays the 20 most populous countries in 2010, plotting population counts along a horizontal axis against country names on the vertical axis. Built with React and D3 v5, the visualization uses SVG rendering with custom components for axes and marks, pulling data from a remote CSV file. The chart formats population values in billions and includes hover tooltips, with the code demonstrating modular component reuse and D3’s scaleBand and scaleLinear APIs for layout.
AI-generated descriptionA demonstration of how to start using D3 version 6.
MIT Licensed



Comments
Sign in to join the discussion.