🌍 Public
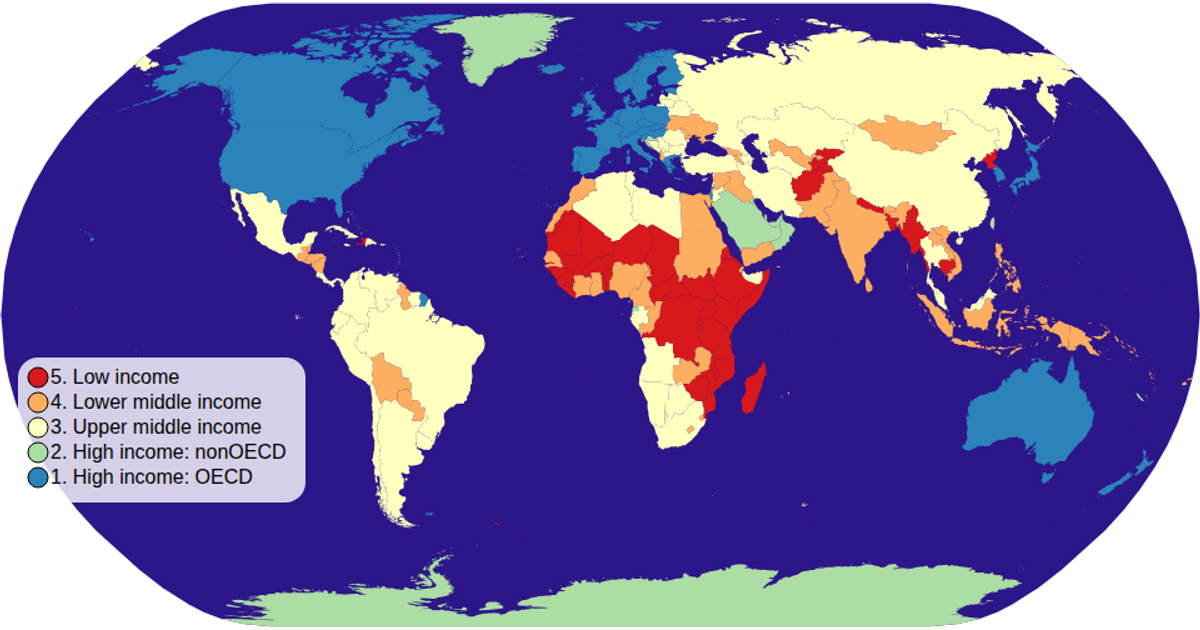
Choropleth Map
Cceresfin
Last edited Feb 1, 2021
Created on Jan 31, 2021
Forked from Fork of Maps with Cheap Tricks for Interaction
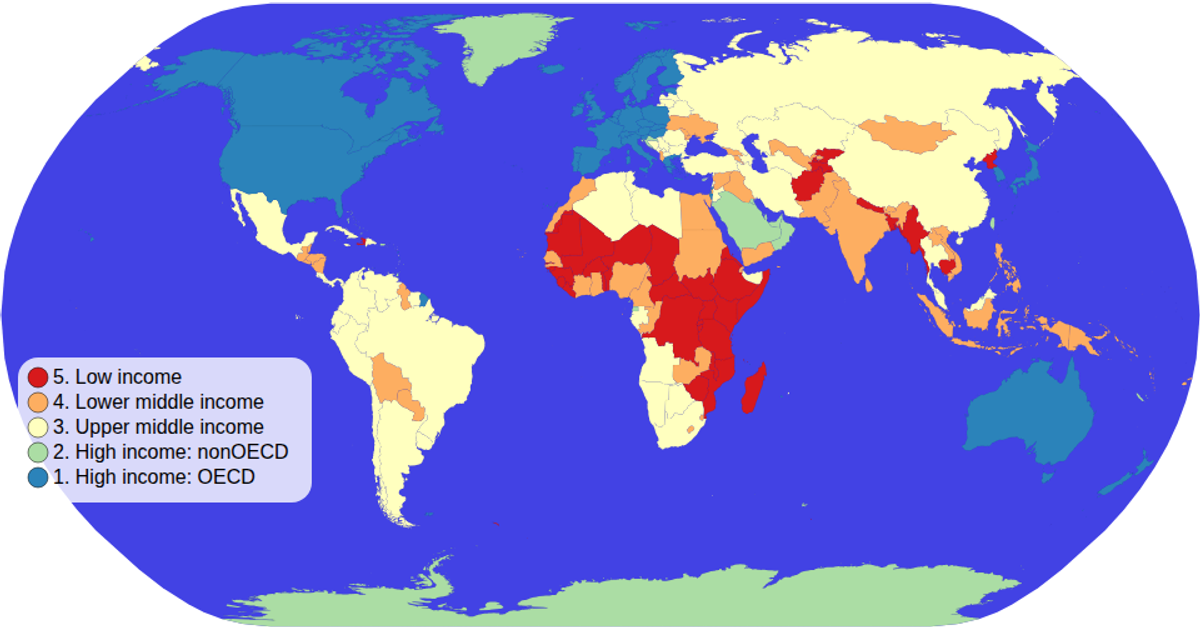
This choropleth map depicts global income groups, coloring countries according to their income classification. Built with D3 v5 and TopoJSON, it loads world map data and country metadata, then projects it using a natural Earth projection with `d3.geoPath`. A color legend uses `scaleOrdinal` and `schemeSpectral` to map income groups to colors. The visualization supports zooming via `d3.zoom` and shows interactive hover states that display country names and income levels.
AI-generated descriptionDemonstrates fundamental DOM manipulation using D3.js by making a smiley face whose eyebrows move.
MIT Licensed



Comments
Sign in to join the discussion.