🌍 Public
Fork of Let´s make a bar chart!
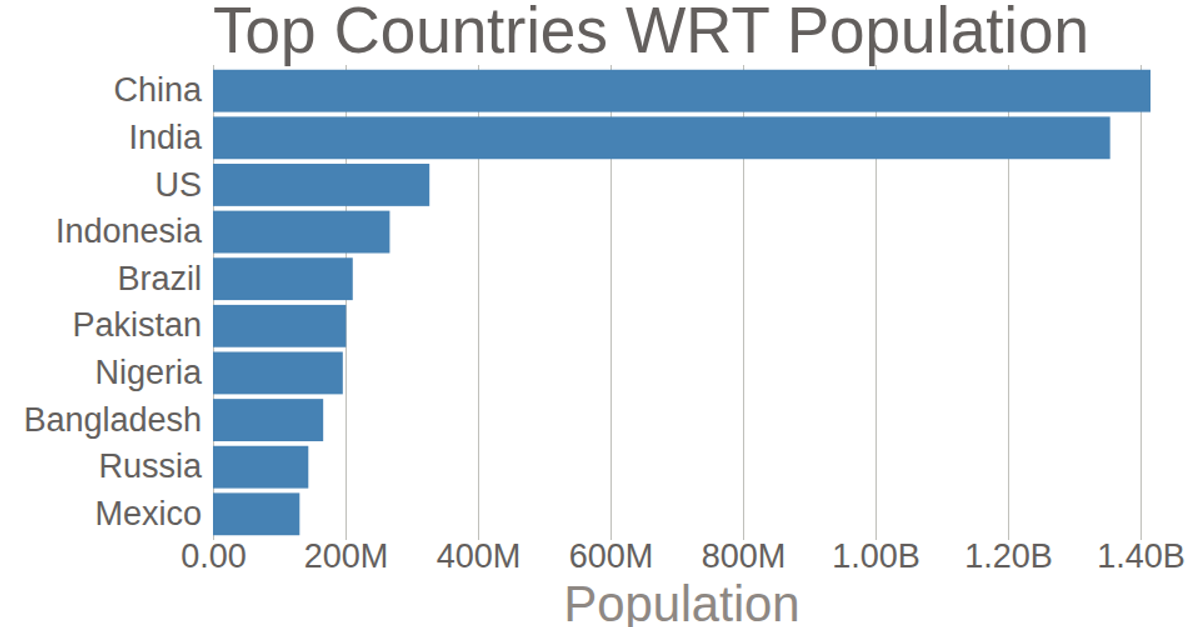
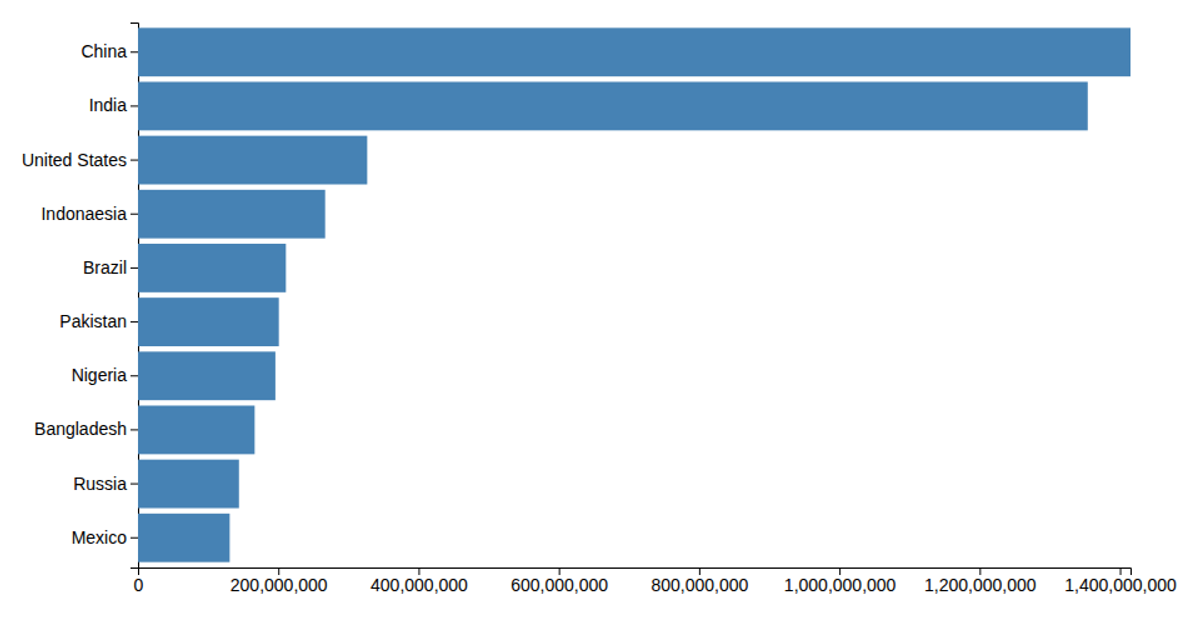
This example displays a horizontal bar chart ranking countries by population, using data from a local CSV file. The visualization encodes population values with bar widths and country names along the y-axis. Built with D3 v5, it uses `d3.csv`, `d3.scaleLinear`, `d3.scaleBand`, `d3.axisLeft`, and `d3.axisBottom` to generate SVG elements. The bars are styled with steelblue fills, and axes are rendered with default tick formatting.
AI-generated descriptionMIT Licensed





Comments
Sign in to join the discussion.