🌍 Public
AQI-city
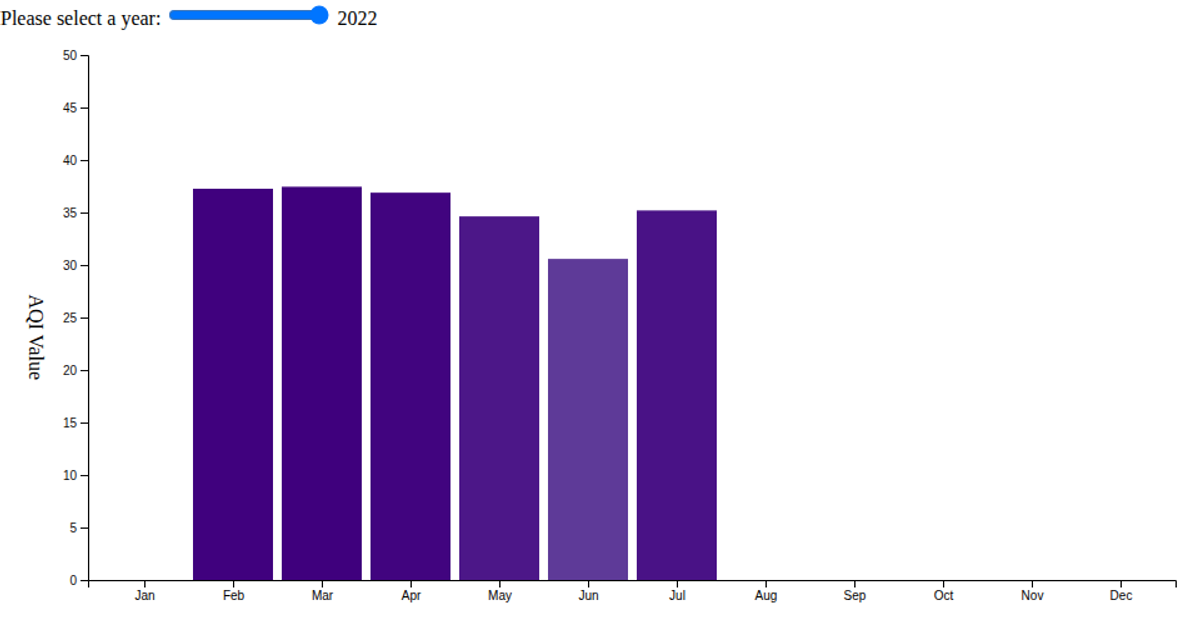
This interactive line chart visualizes daily Air Quality Index (AQI) readings for the city of Bangor, Maine, throughout 2022. A dropdown menu allows the user to switch between two pollutant types, Ozone and PM2.5, enabling comparison between the two time series. The visualization renders as an SVG using React, with D3 v5 handling the scales, axes, natural curve interpolation for the line, and data point circles that display exact AQI values on hover. The underlying dataset is loaded from a remote CSV file.
AI-generated descriptionMIT Licensed





Comments
Sign in to join the discussion.