🌍 Public
Fork of Fork of Hello VizHub
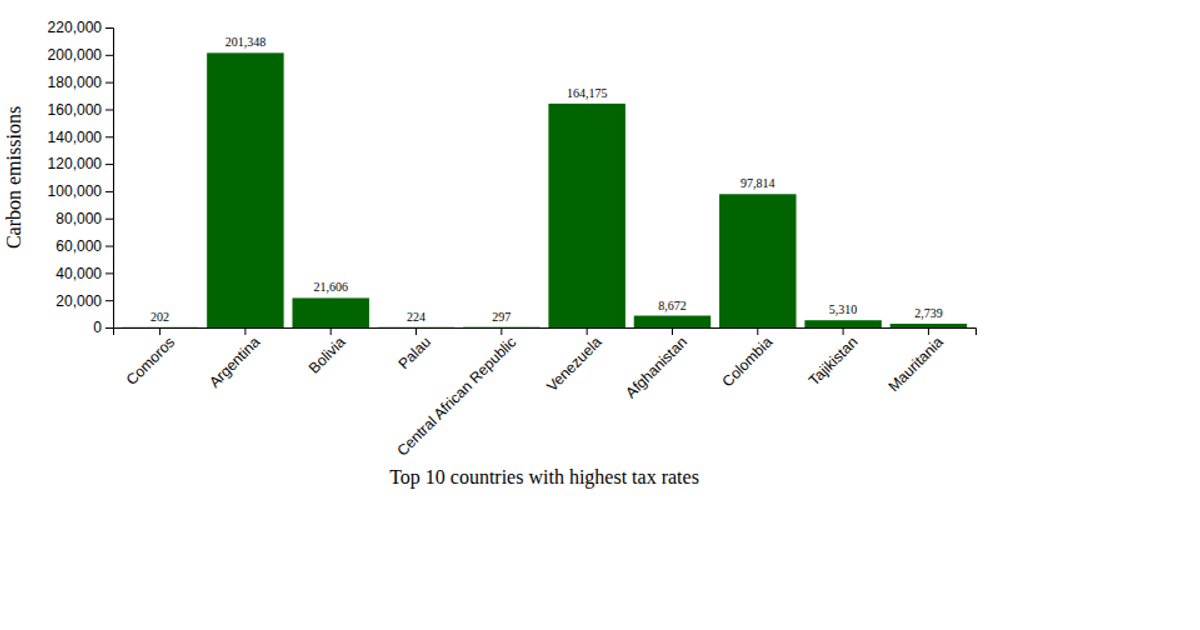
This scatter plot visualizes the relationship between total tax rate and CO2 emissions for the top ten countries with the highest tax rates, using data from a GitHub-hosted CSV file. It renders an SVG chart with D3 v7, employing `d3.csv` to load the data, `d3.scaleLinear` for both axes, and `d3.axisBottom` and `d3.axisLeft` to draw the axes. Steel-blue circles mark each country, with text labels positioned adjacent to each point. The x-axis and y-axis are labeled “Total Tax Rate (%)” and “CO2 Emissions (kt)” respectively, providing a clear comparison of the two metrics.
AI-generated descriptionMIT Licensed




Comments
Sign in to join the discussion.