🌍 Public
Fork of ICE-5: Loading and Parsing CSV Data with D3.js
SSushmareddy-gudipally
Last edited Feb 28, 2022
Created on Feb 28, 2022
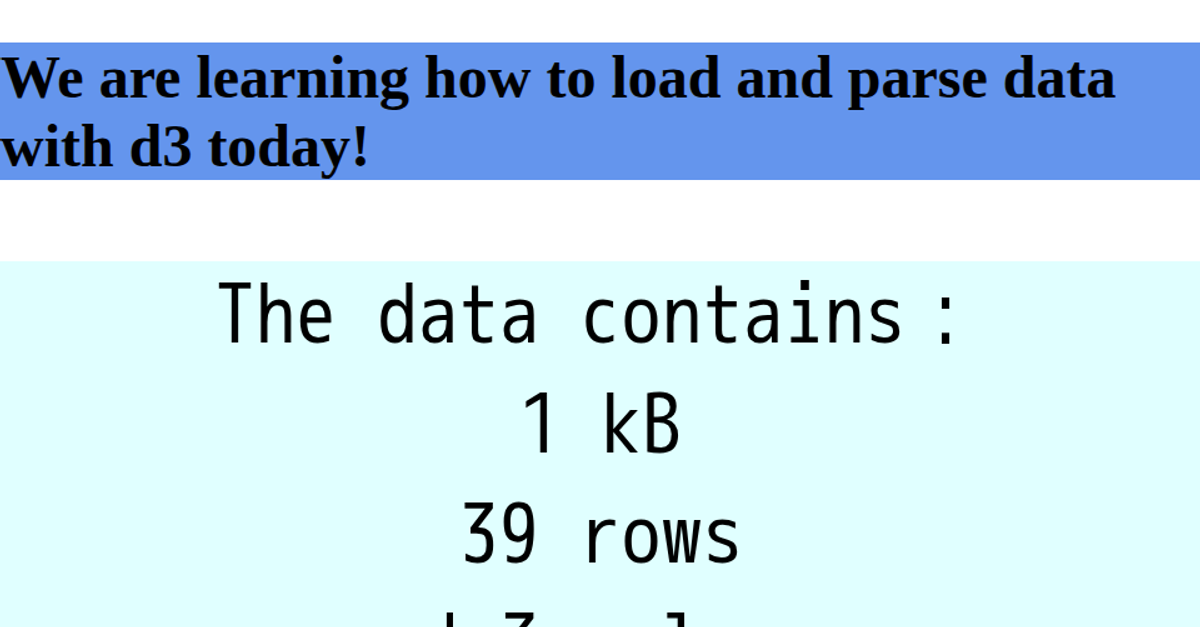
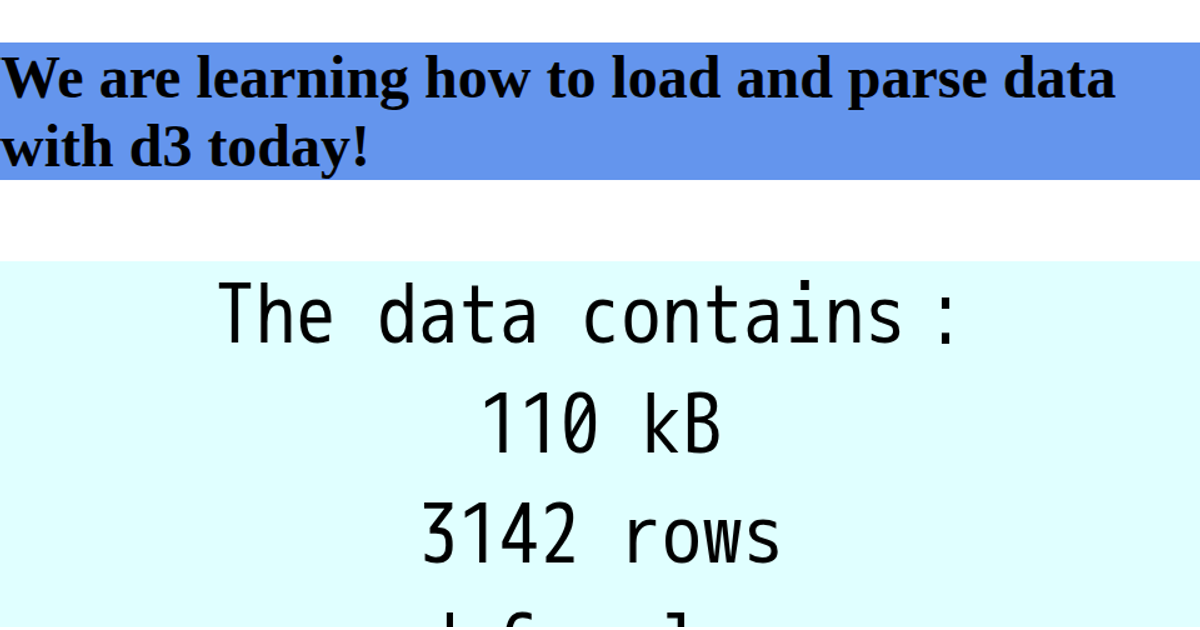
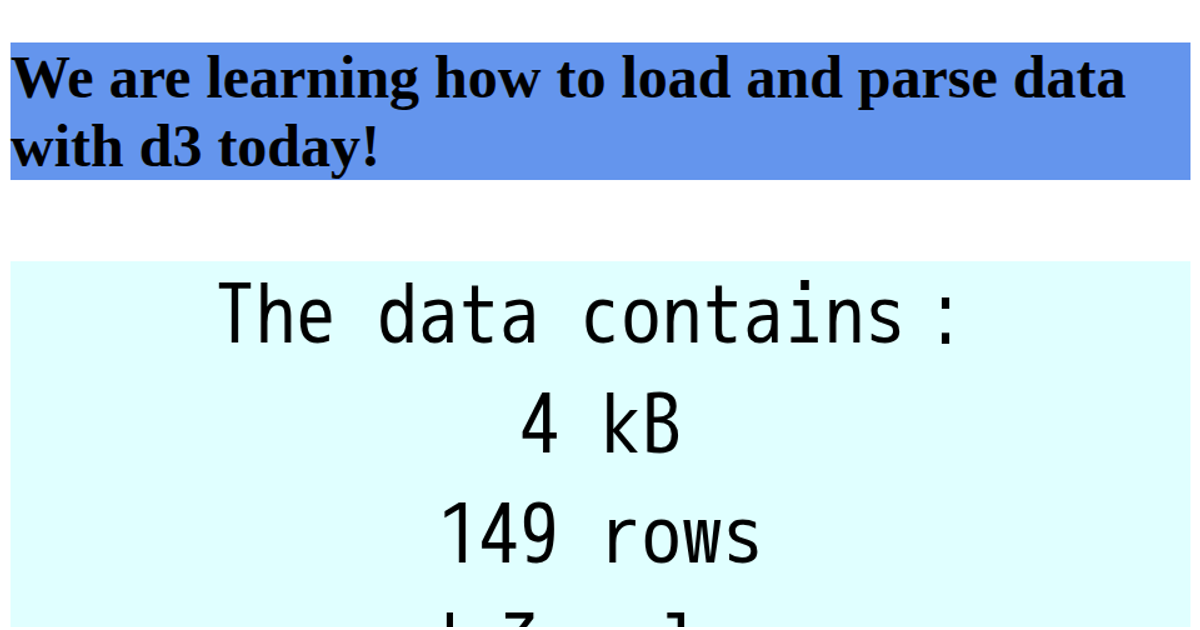
This example displays population data for districts of Telangana using a static SVG map with decorative elements and a text summary of the loaded dataset. The page loads a CSV file from a GitHub gist via `d3.csv`, then computes and displays the file size in kilobytes, row count, and column count using `d3.csvFormat`. The visualization pairs this parsed data summary with a hand-drawn SVG map of the region, rendered in a React component with D3.js v7 for data handling and SVG for graphics.
AI-generated descriptionA bare minimum HTML page demonstrating use of CSS and JavaScript.
See also React Starter.
MIT Licensed


Comments
Sign in to join the discussion.