🌍 Public
Q3
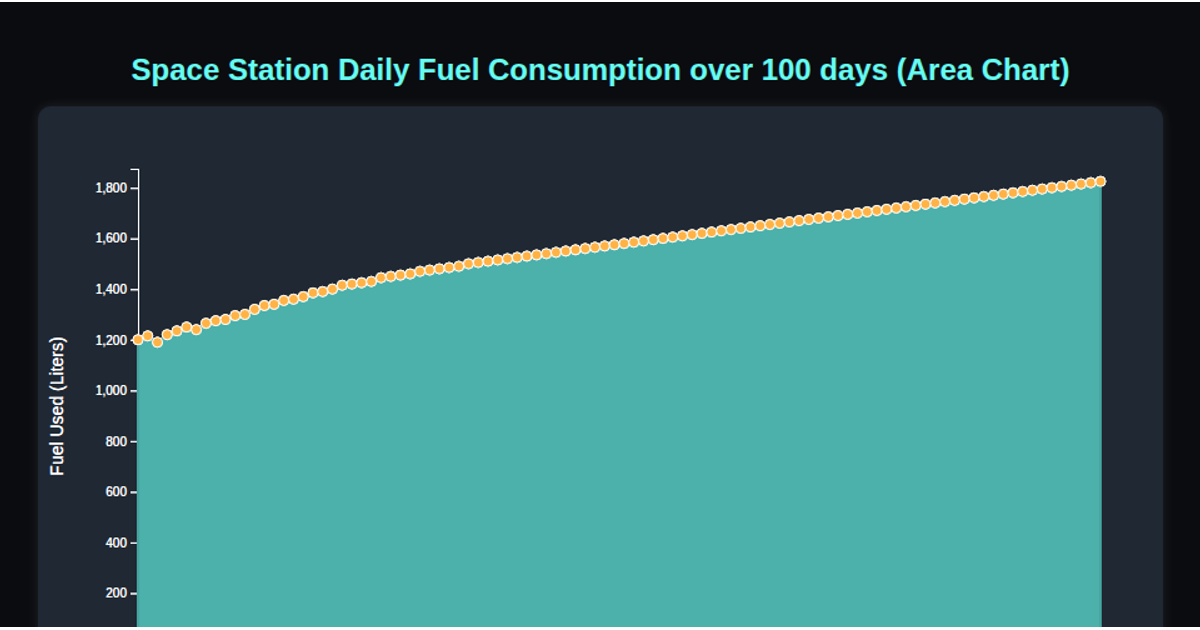
A line chart visualizes 100 days of space station fuel consumption, showing a steady upward trend from roughly 1,200 to 1,825 liters. The visualization uses D3.js v7 with SVG rendering to draw a monotone-smoothed line and circular data points. Hovering over any point triggers a CSS tooltip displaying the exact day and fuel amount. The chart loads data from a CSV file, uses `d3.scaleLinear` for both axes, and constructs the path with `d3.line` and `d3.curveMonotoneX`.
AI-generated descriptionMIT Licensed




Comments
Sign in to join the discussion.