🌍 Public
Line Chart with P5 and D3
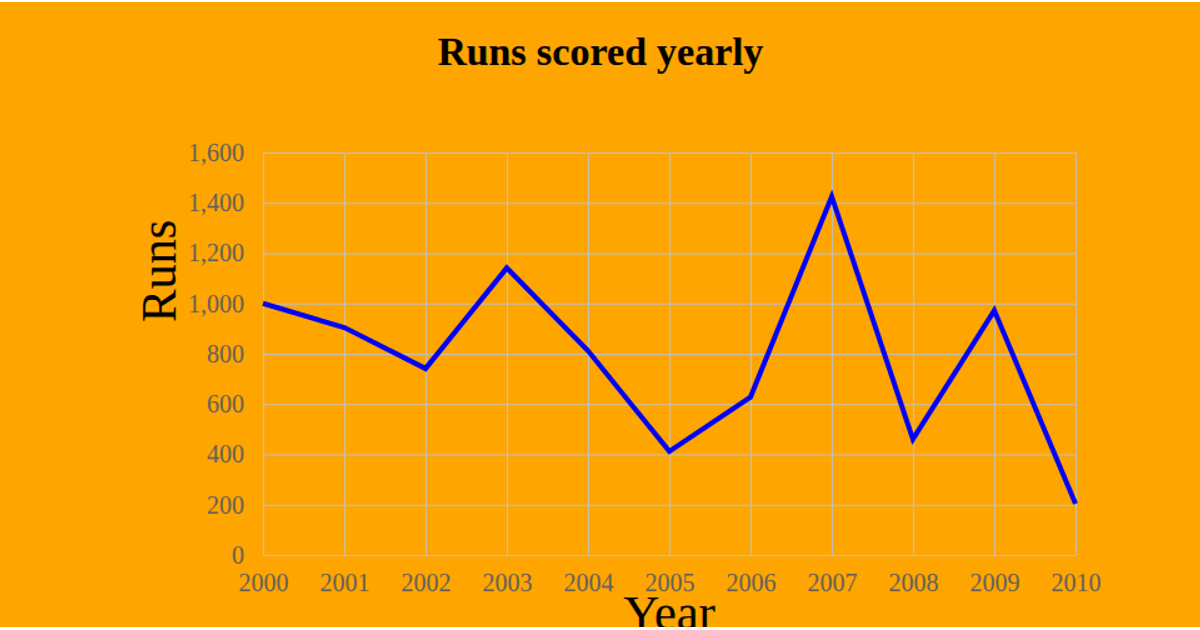
This visualization plots both minimum and maximum Arctic sea ice extent from 1979 to 2025 using a dual-line chart rendered in p5.js. The code loads CSV data with d3.csv, then maps years and ice measurements to screen coordinates through d3.scaleLinear functions. Red and blue lines with circular points display the yearly minimum and maximum values, while grid lines, axis labels, and a legend clarify the chart. The p5.js draw loop renders the visualization dynamically, adapting to window resizing via windowResized.
AI-generated descriptionMIT Licensed


Comments
Sign in to join the discussion.