🌍 Public
Fork of Women in Parliament
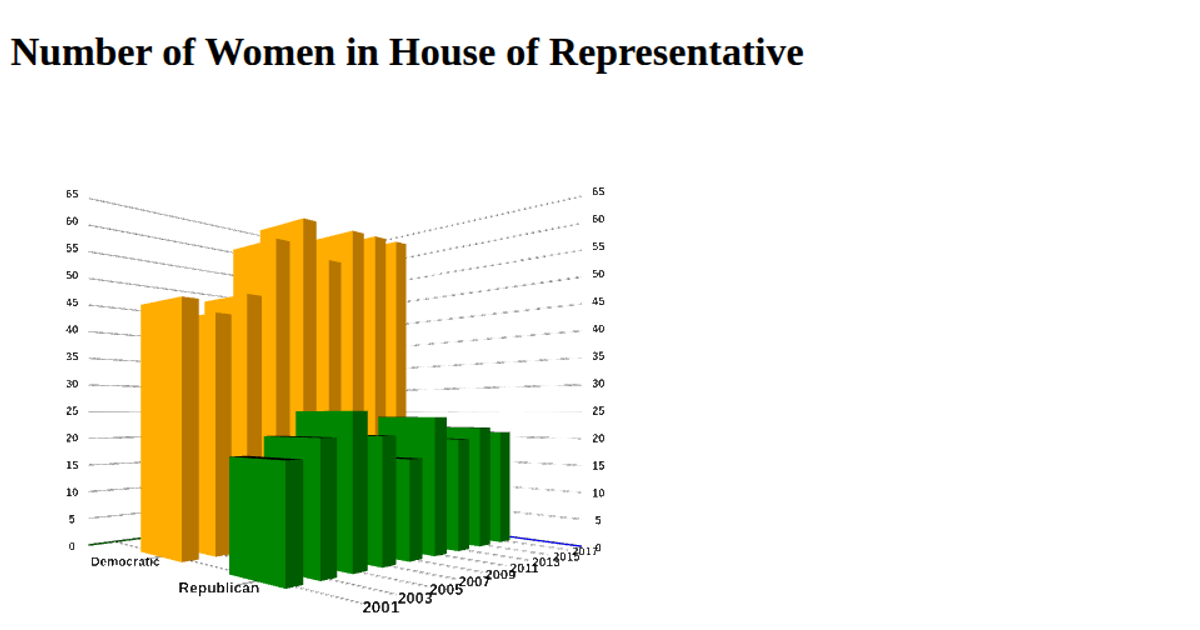
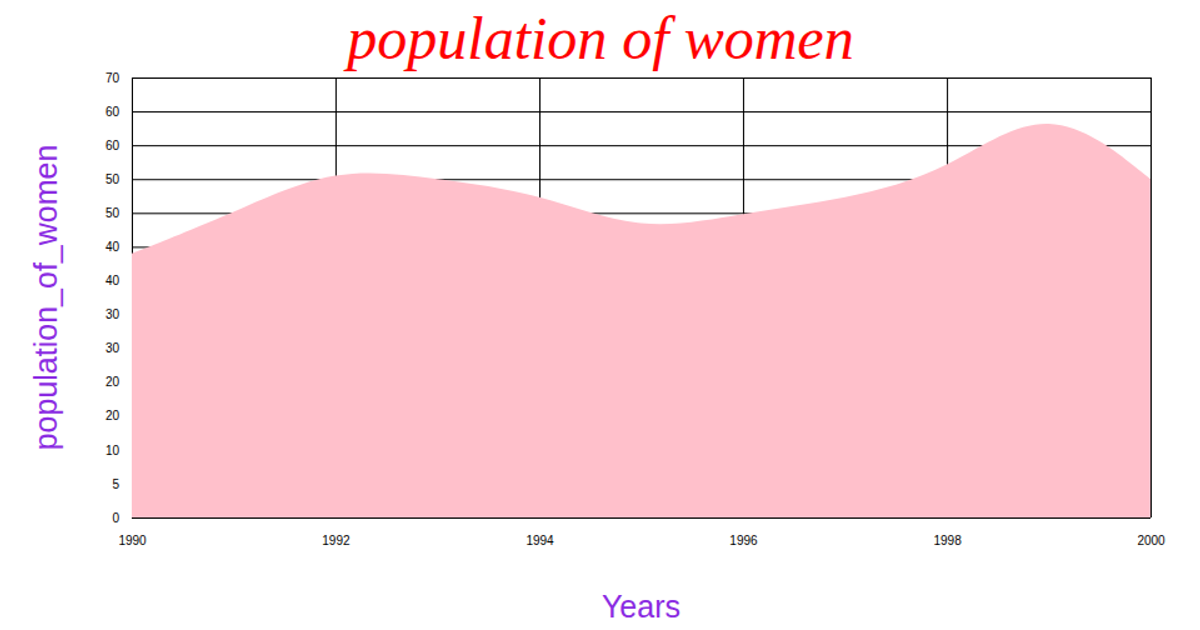
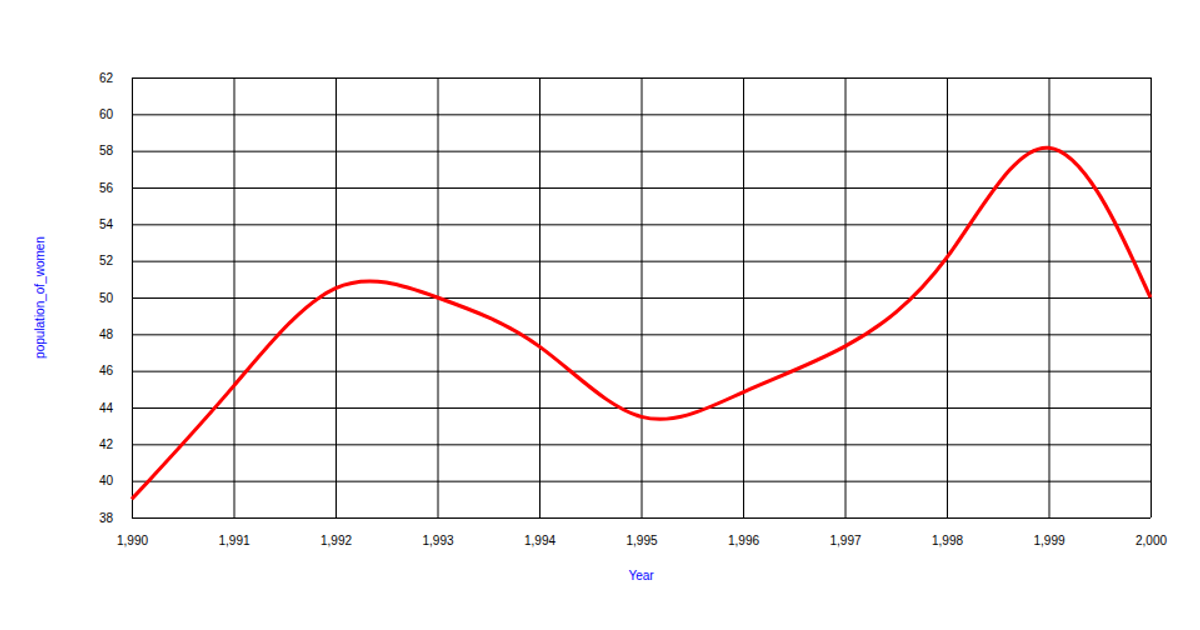
This chart uses a green area graph with a red stroke to show the total number of women in the U.S. Congress from 1993 to 2000, based on a CSV dataset from a GitHub gist. Built with d3.v5, it uses `area`, `scaleLinear`, `axisBottom`, and `axisLeft` to render the SVG, with the x-axis labeled "Years" and the y-axis labeled "Women_total." The visualization is a fork of an original example, and it only displays a sliced subset of the data (rows 44–52).
AI-generated descriptionThis line chart shows one week of temperature (in degrees Celcius) in San Francisco. The data comes from Data Canvas - Sense Your City.
Made in this video:
MIT Licensed





Comments
Sign in to join the discussion.