🌍 Public
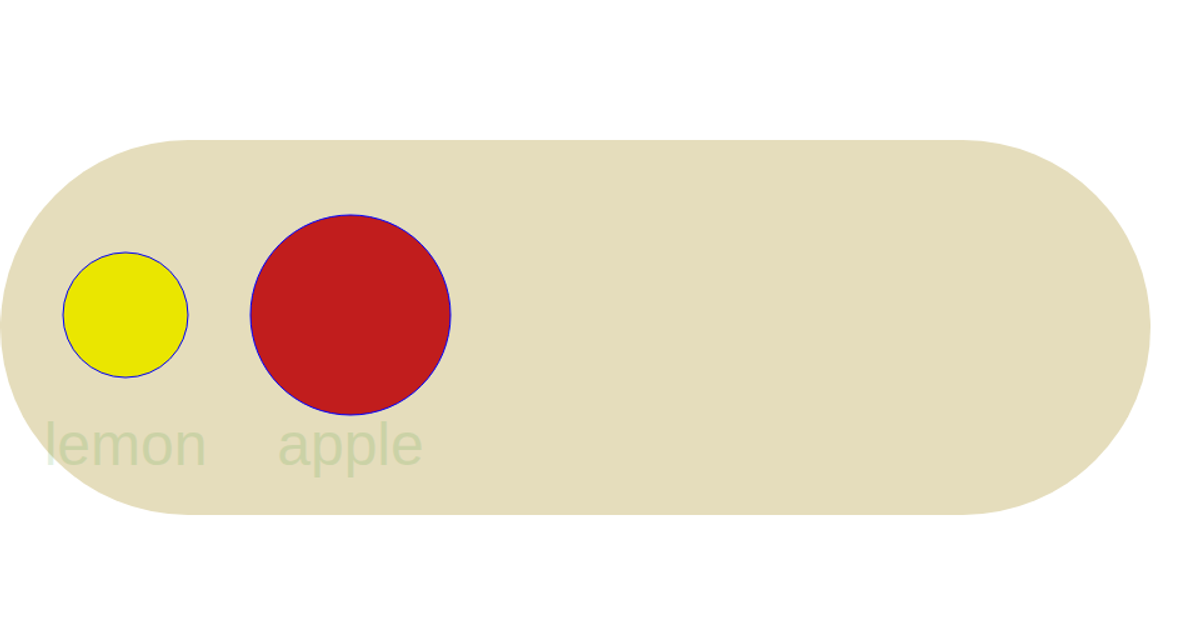
Bowl of Fruit - General Update Pattern Special Cases
EEvgeny
Last edited Jun 9, 2020
Created on Jun 7, 2020
This example demonstrates a bar chart with gradient-filled rectangles, showing 20 random data points over time. The bars animate from the bottom of the chart upwards using a transition with staggered delays. The visualization employs D3 v5’s general update pattern, using `selectAll`, `enter`, `merge`, and `exit` to manage the SVG elements. It uses `d3.scaleTime` and `d3.scaleLinear` for positioning, `d3.axisBottom` and `d3.axisLeft` for axes, and defines a linear gradient via SVG’s `linearGradient` element with custom color stops.
AI-generated descriptionMIT Licensed



Comments
Sign in to join the discussion.