🌍 Public
Temp Area Plot
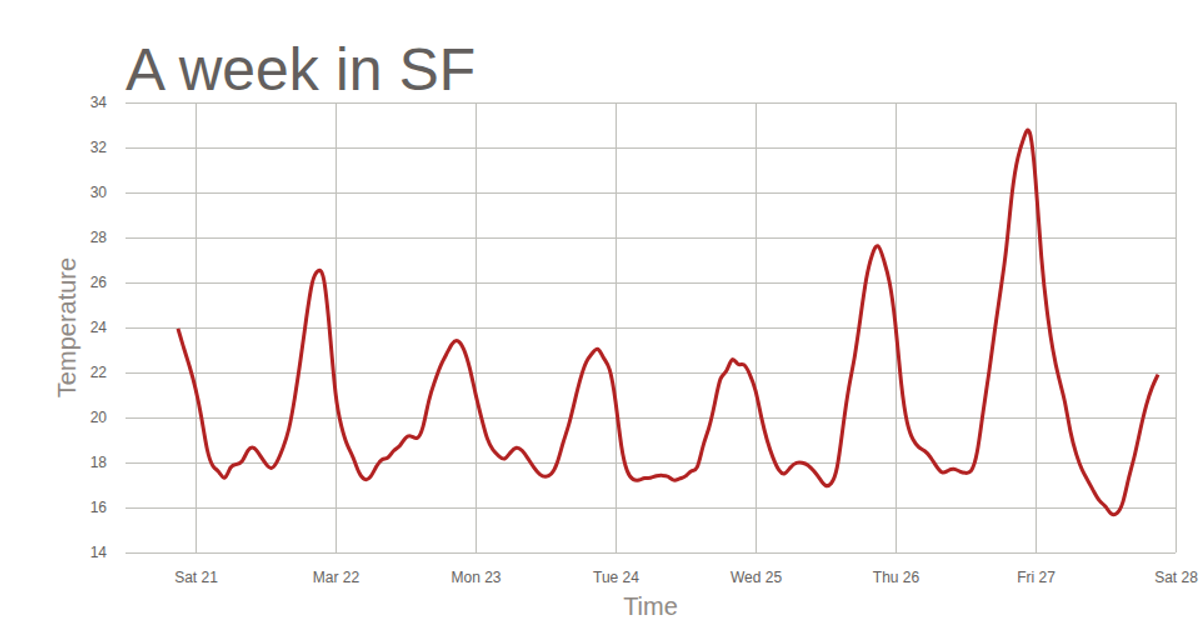
This visualization shows temperature readings in San Francisco over a week, displayed as a smooth area chart with time on the x-axis and temperature on the y-axis. The graph, rendered as an SVG, uses a firebrick-colored filled area beneath a curve created with D3’s `area()` and `curveBasis` functions. The code loads the temperature data from a CSV file and processes timestamps as dates. Axes are generated using `scaleTime` and `scaleLinear` scales, with grid lines and labels added via `axisBottom` and `axisLeft`, and axis titles and chart title are included in the layout.
AI-generated descriptionMIT Licensed



Comments
Sign in to join the discussion.