🌍 Public
Using arcs for rendering Data with React
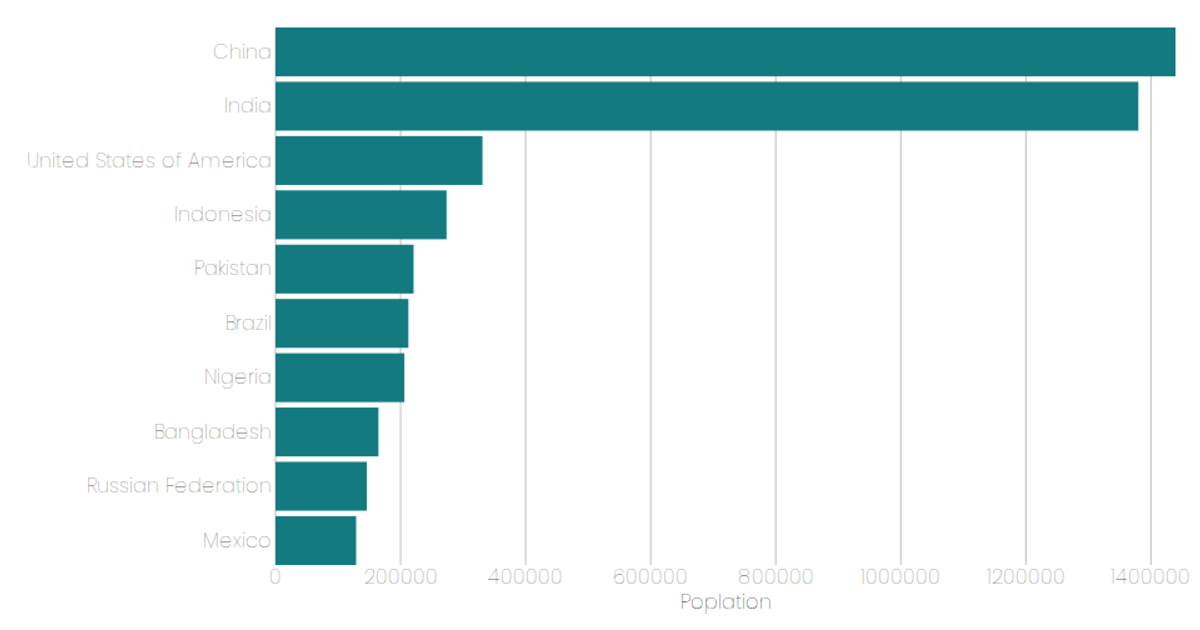
This example visualizes United Nations population data from a CSV file, loading the data with `d3.csv` into React state via the `useState` and `useEffect` hooks. It renders the dataset as a series of SVG rectangles whose height and width are mapped to population values, with a loading indicator shown until the data arrives. The code demonstrates integrating D3’s data-loading utilities with React’s component lifecycle and SVG rendering.
AI-generated descriptionA program that loads in some data about CSS named colors using D3 utilities and uses react state to keep track of the data.
MIT Licensed




Comments
Sign in to join the discussion.