🌍 Public
Task 8-Tutorial3.2_Q
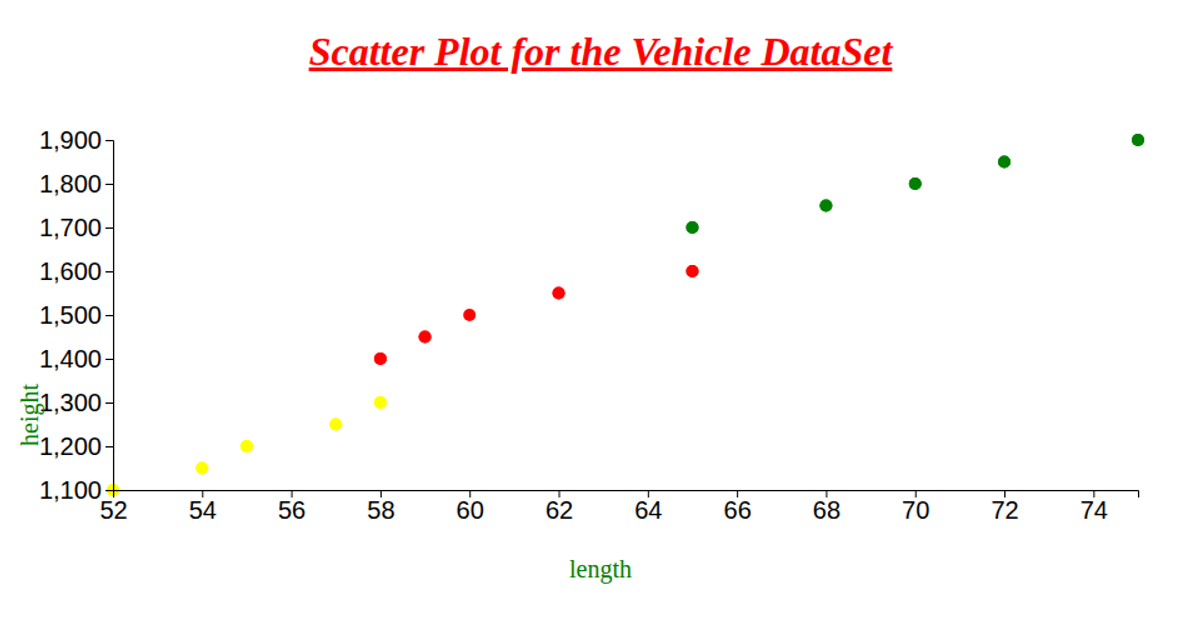
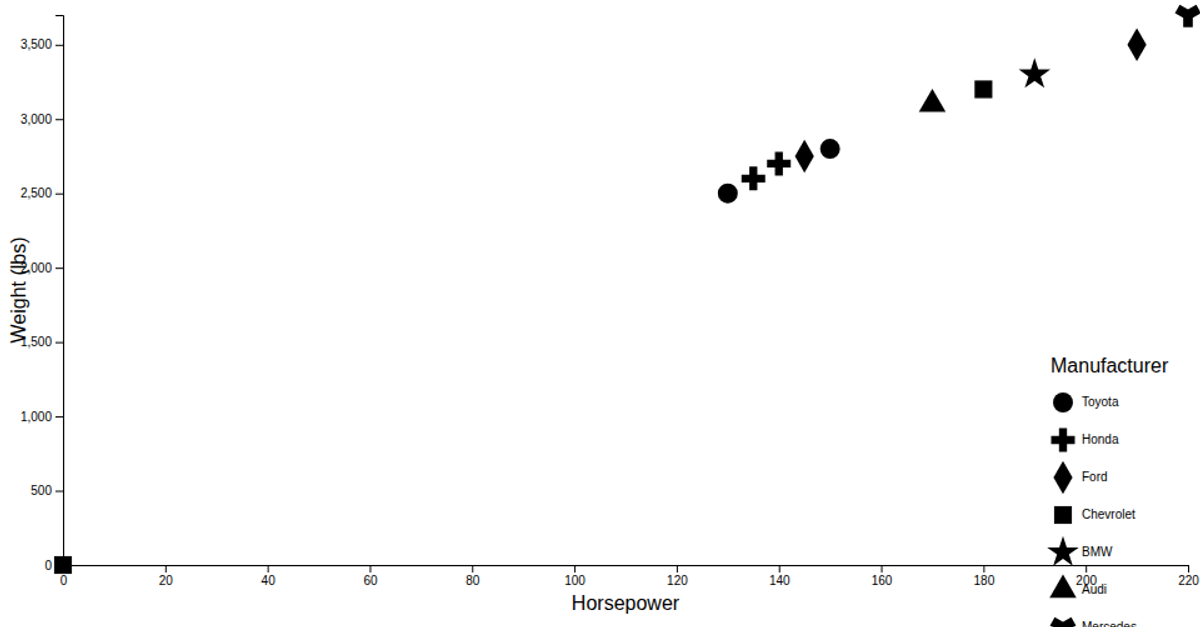
This scatter plot visualizes the vehicle dataset, mapping vehicle length on the x-axis and height on the y-axis, with different vehicle types distinguished by distinct point shapes. The visualization uses d3.scaleLinear for axes, d3.scaleOrdinal with d3.symbolsFill to assign shapes, and d3.symbol to render the marks. The chart includes axis labels and a shape legend generated via the shapeLegend component, with data loaded asynchronously from a CSV file using d3.csvParse.
AI-generated descriptionWe are Displaying the IRIS dataset using Scatter plot.
MIT Licensed



Comments
Sign in to join the discussion.