🌍 Public
Vikas Area Chart
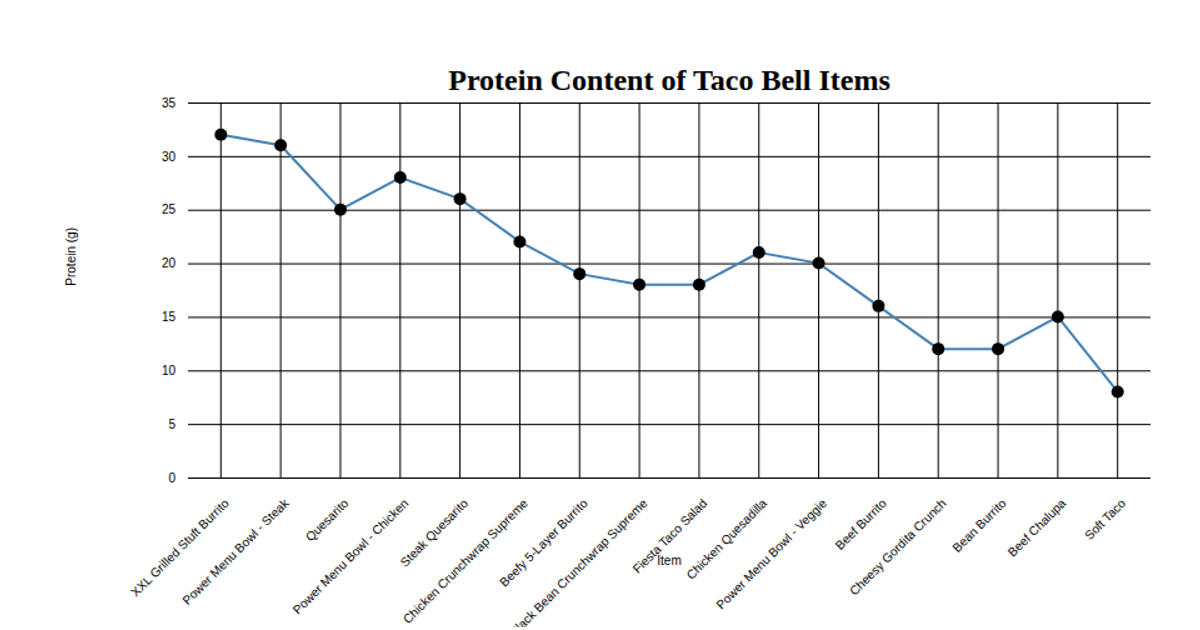
This area chart displays the protein content in grams for various Taco Bell menu items, with data loaded from a CSV file hosted on GitHub. The visualization uses D3 v5 APIs including `scaleBand` for the categorical x-axis, `scaleLinear` for the y-axis, and `area` to generate the filled path. Individual data points are marked with red circles, and the chart includes rotated x-axis labels for readability. The SVG rendering includes styled axes and a bold title, with data loaded via the `csv` function.
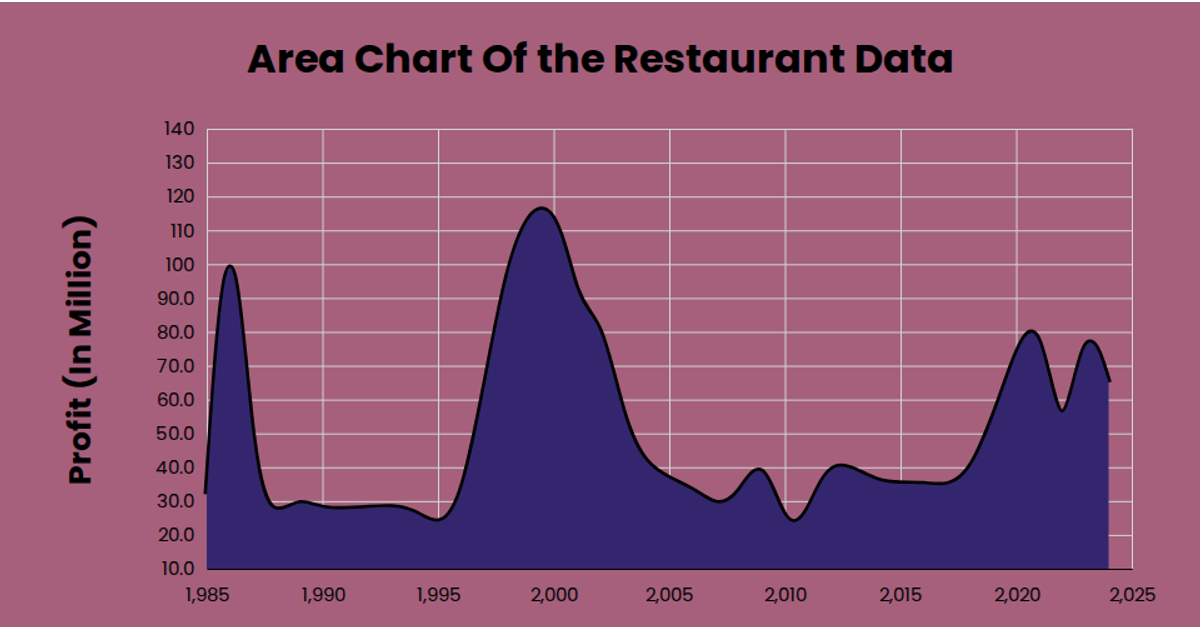
AI-generated descriptionThis area chart shows one week of temperature (in degress Celcius)in San Francisco, from Data Canvas Sense your City
MIT Licensed


Comments
Sign in to join the discussion.