🌍 Public
Property tax rate per county over the years ny
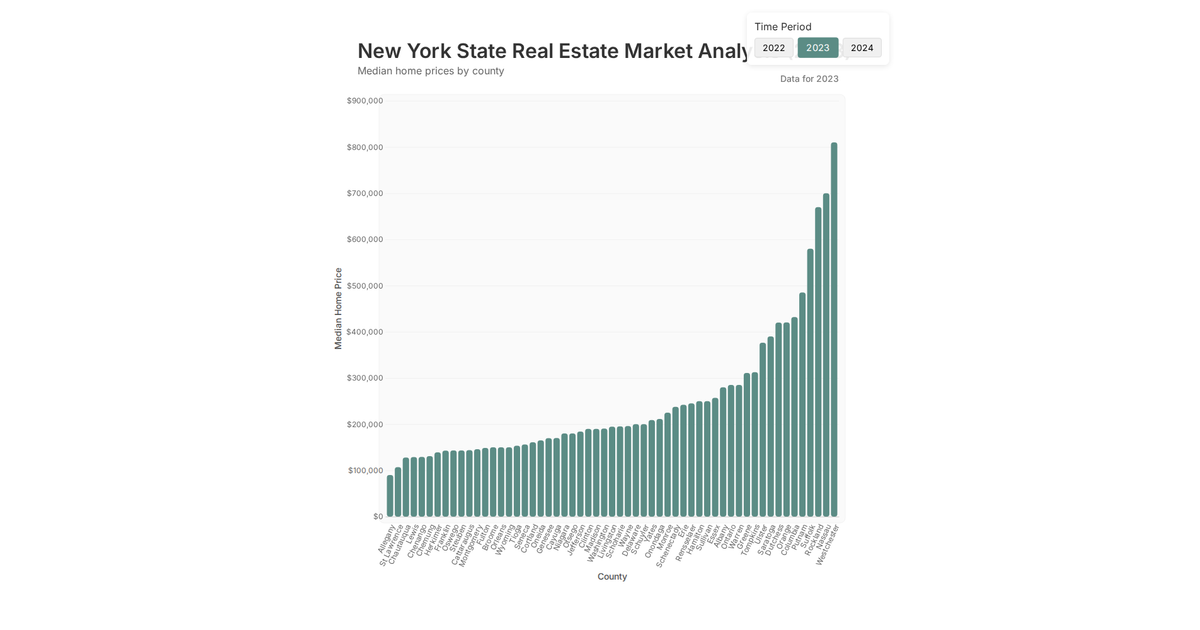
This interactive chart displays the property tax rates for the top 25 counties in New York across four years. A clickable year selector—implemented with React state and D3’s `scaleLinear` and `scaleBand`—updates the visualization, presenting each county as a dot with a value label. Users can click individual dots to highlight a specific county, with fill color and opacity changes reflecting the selection. The chart renders using D3’s SVG joins and axes, driven by data loaded from a CSV file.
AI-generated descriptionMIT Licensed



Comments
Sign in to join the discussion.