🌍 Public
Lab 06, Grafico de Barras
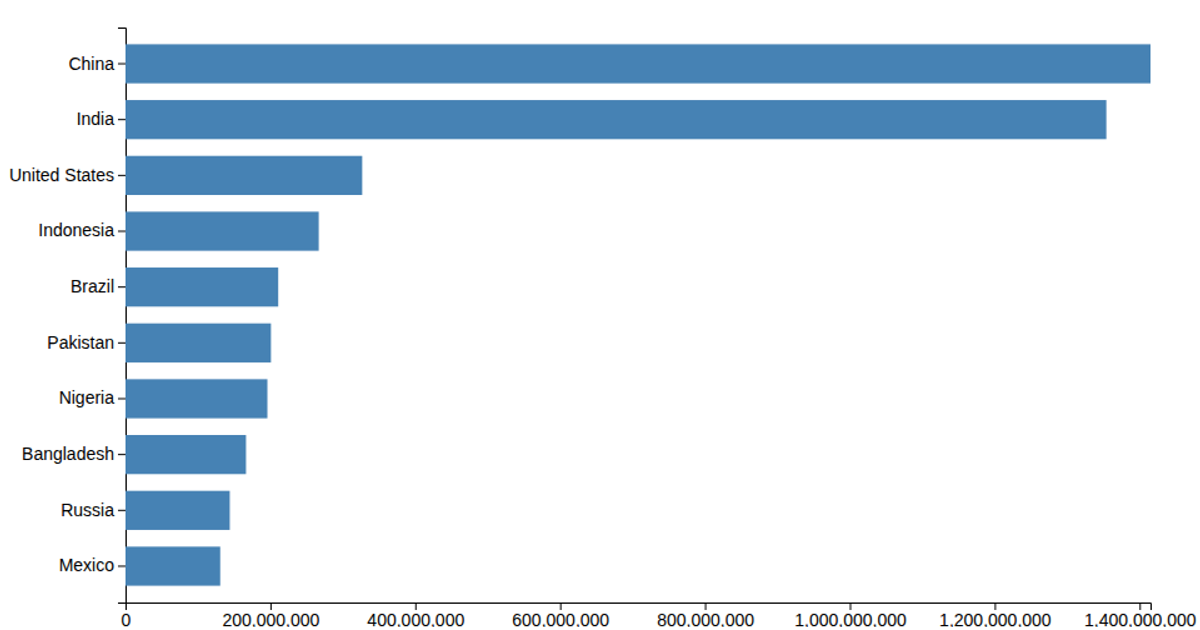
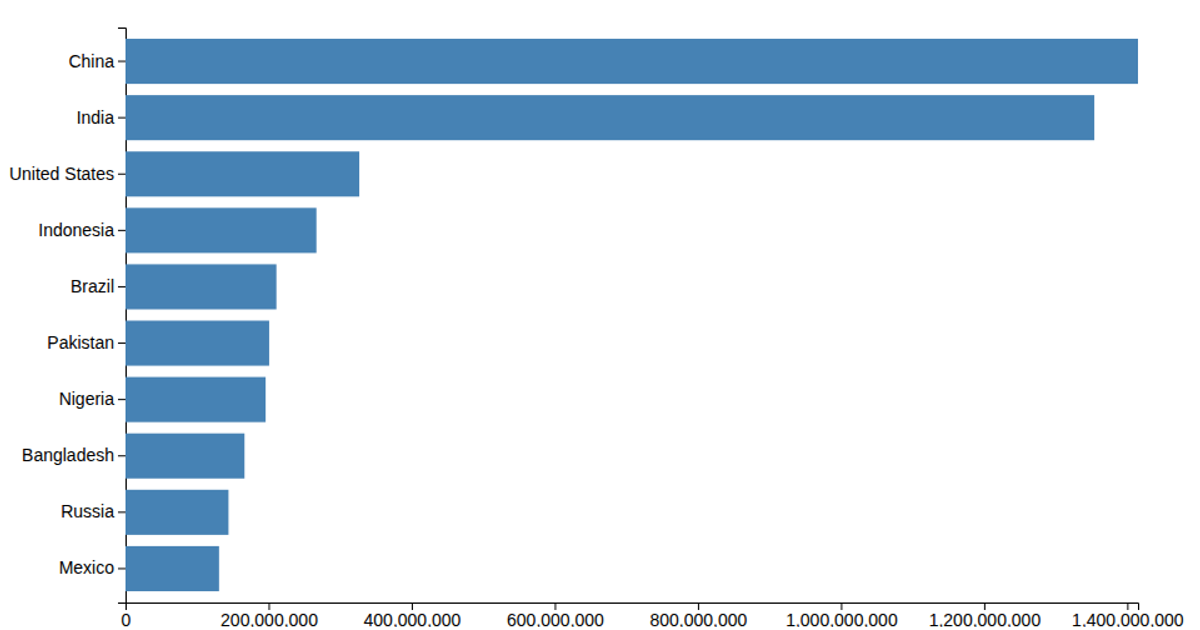
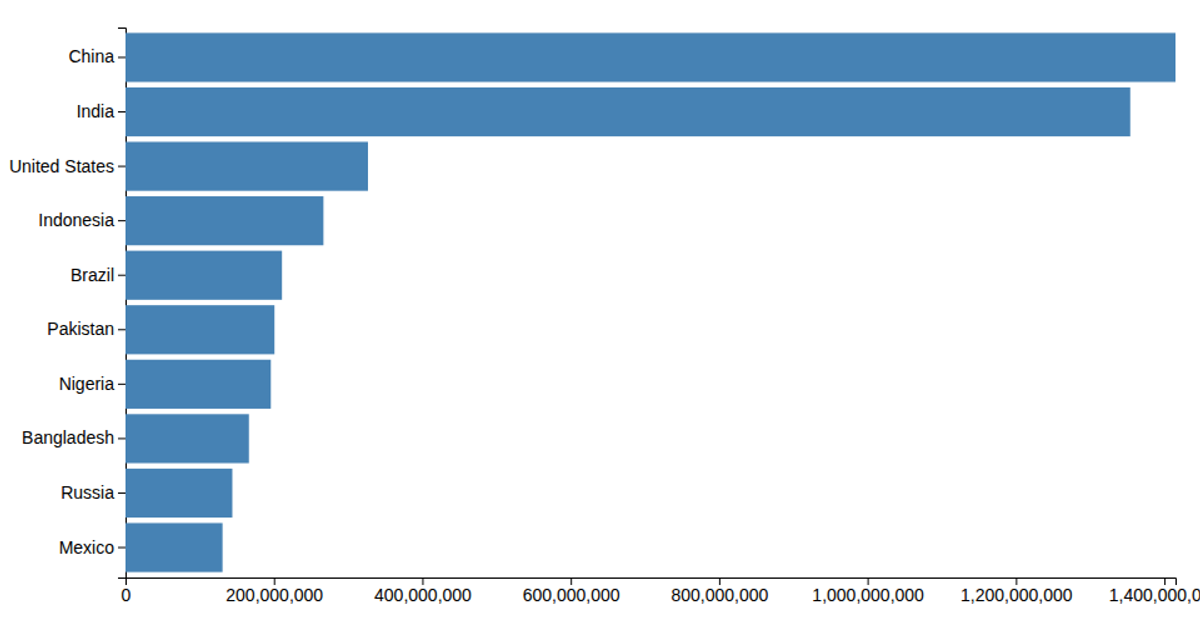
This bar chart displays the population of seven Costa Rican provinces, based on 2018 United Nations World Population Prospects data. It uses D3 v5 with `d3.csv` to load data, `d3.scaleLinear` for the x-axis, and `d3.scaleBand` for categorical y-axis labels. The chart renders as SVG rectangles filled with light green, with axes created via `d3.axisLeft` and `d3.axisBottom`. Population values are multiplied by 1000 in the data preprocessing step.
AI-generated descriptionThis bar chart shows population of the top 10 most populous countries. The data comes from the year 2018 estimate in United Nations: World Population Prospects 2017.
MIT Licensed




Comments
Sign in to join the discussion.