Daily Coronavirus Confirmed Cases of California and New York State by County
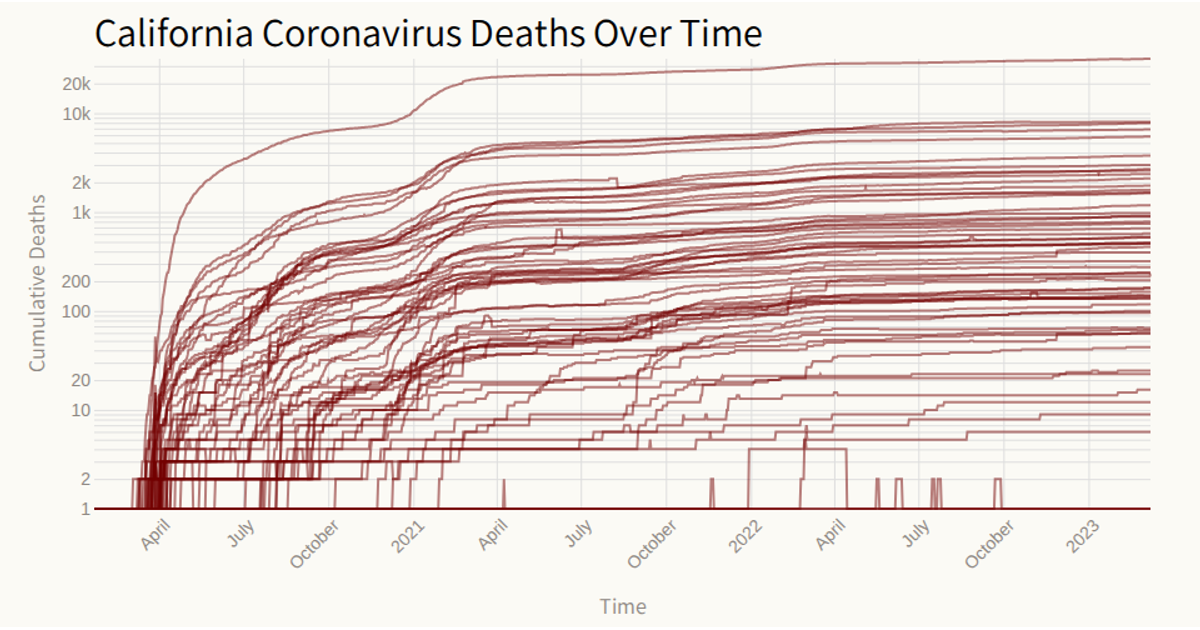
This chart displays the daily confirmed COVID-19 cases for counties in California and New York, plotting each county’s time series on a logarithmic scale. A Voronoi overlay, created with `d3.Delaunay`, enables hover interactions, revealing a tooltip with the total confirmed cases up to that date. The visualization is built with React and D3 v6, using `scaleTime` and `scaleLog` for the axes, and renders as an SVG using `line` and `axisBottom`. Data is sourced from the Johns Hopkins Coronavirus dataset.
AI-generated descriptionLine chart of Coronavirus cases to date of county of California and New York State. Data from [Johns Hopkins Coronavirus Dataset] (https://github.com/CSSEGISandData/COVID-19/blob/master/csse_covid_19_data/csse_covid_19_time_series/time_series_covid19_confirmed_US.csv)
Hover to see total confirmed cases up to that day.




Comments
Sign in to join the discussion.