🌍 Public
Choropleth Map
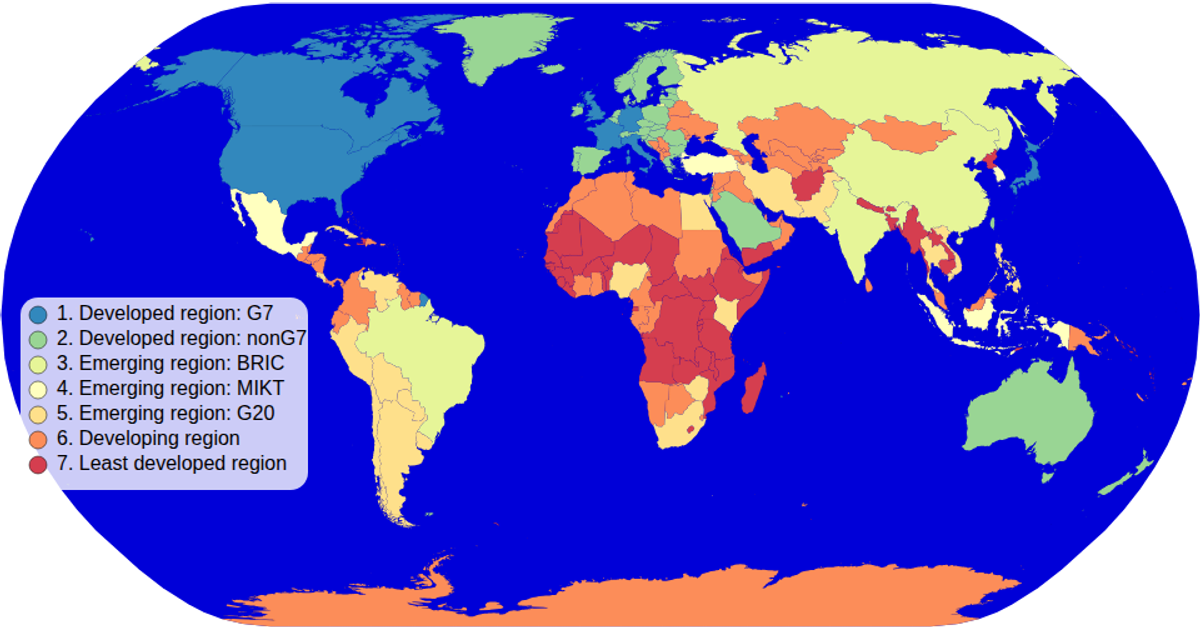
This choropleth map uses color to encode the economy classification of countries, sourced from world-atlas TSV data matched with TopoJSON geometries. D3’s `geoNaturalEarth1` projection and `geoPath` render country outlines as SVG paths, while a sequential spectral color scale (`schemeSpectral`) fills each territory. An interactive zoom control, built with D3’s `zoom` event, adjusts the projection transform, and a custom legend (from `colorLegend.js`) displays the ordinal scale’s categories with hover effects highlighting individual countries.
AI-generated descriptionMIT Licensed




Comments
Sign in to join the discussion.