🌍 Public
Responding to Resize
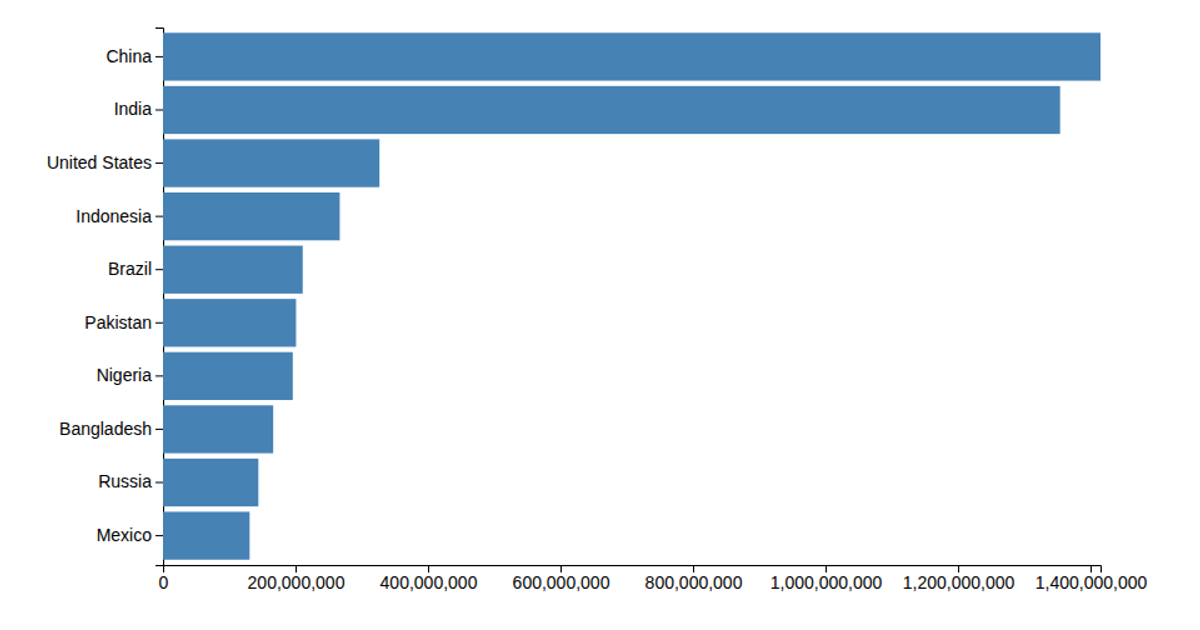
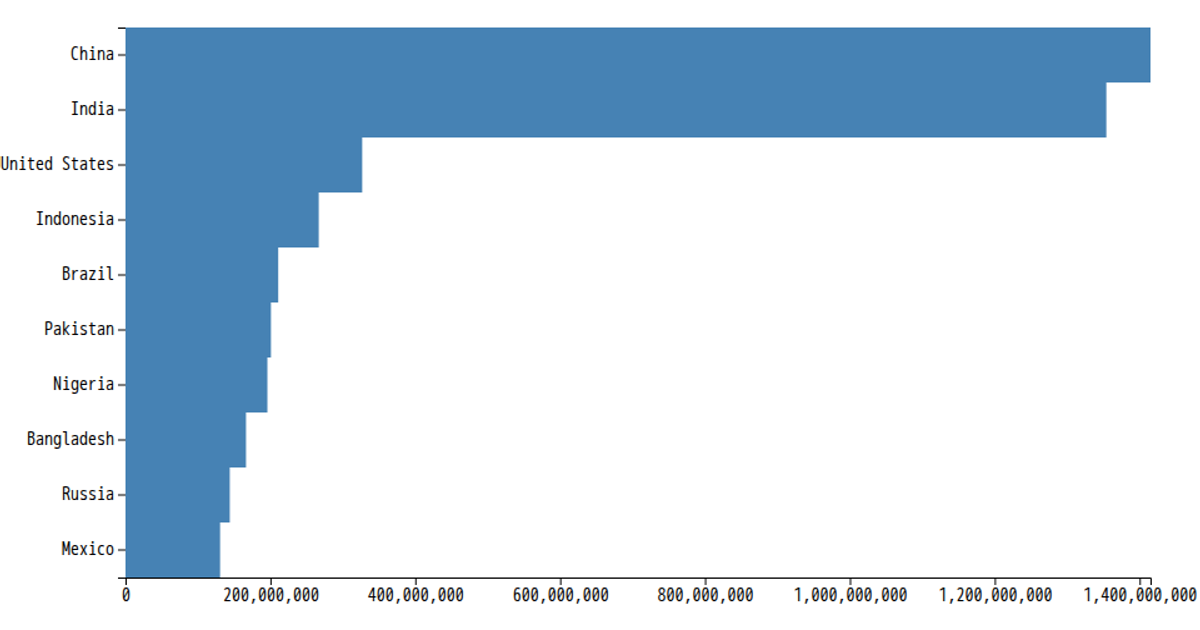
This example shows a bar chart of population by country that redraws its X-shaped guide lines whenever the browser window is resized. The code uses `clientWidth` and `clientHeight` to extract the computed CSS dimensions of the chart container, then sets the SVG’s `width` and `height` attributes accordingly. It employs a `window.addEventListener("resize", redraw)` to trigger the update. The bar chart itself is built with `d3.scaleLinear`, `d3.scaleBand`, `d3.axisLeft`, and `d3.axisBottom`, using population data loaded from a CSV file.
AI-generated descriptionMIT Licensed




Comments
Sign in to join the discussion.