🌍 Public
D3 bar
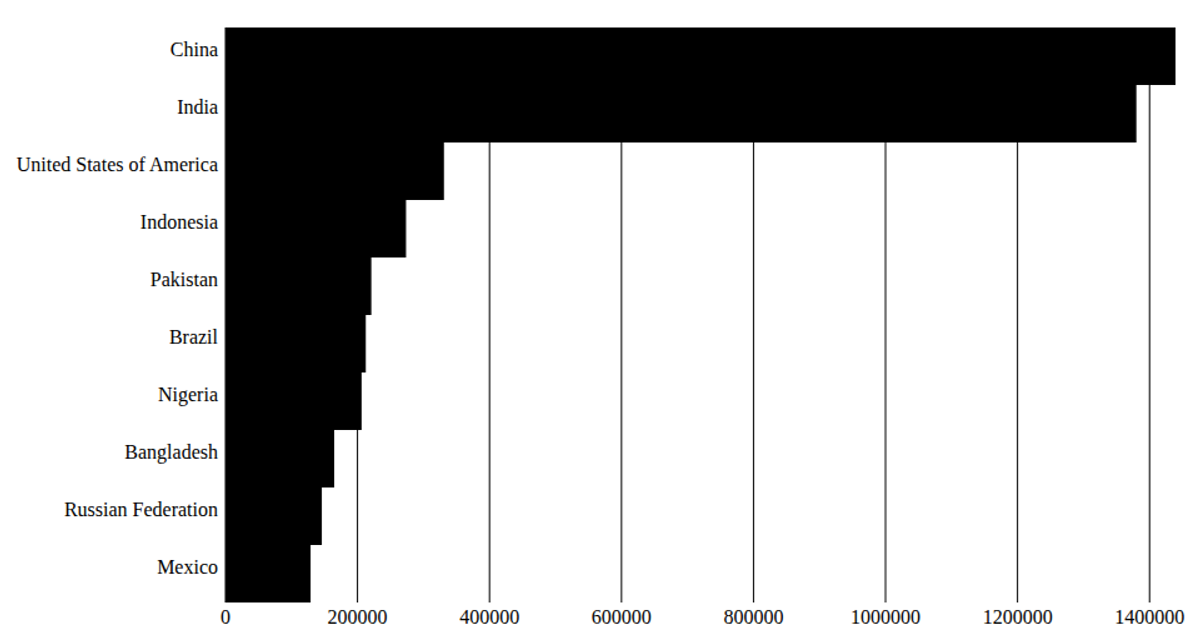
This example displays a horizontal bar chart of the top ten countries by 2020 population from a UN dataset. The bars animate their width over one second using SVG's `<animate>` element. The visualization uses React to manage state and D3 v7 functions like `scaleLinear`, `scaleBand`, `max`, and `csv` to fetch and scale the data, rendering tick marks, labels, and bars as SVG elements.
AI-generated descriptionReact Starter code.
MIT Licensed






Comments
Sign in to join the discussion.