🌍 Public
Untitled
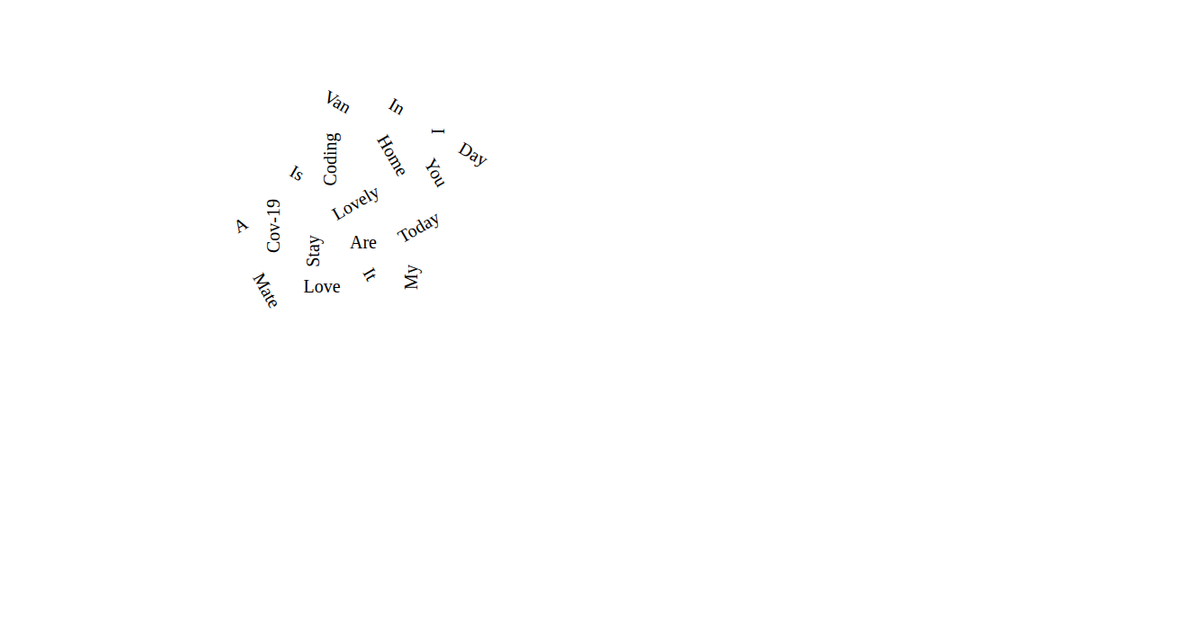
This example presents a word cloud visualization that displays COVID-19 public health guidance text. The words are sized by frequency, while a d3.layout.cloud layout arranges them in a circular, randomized rotation pattern. Rendered as animated SVG text elements, the visualization uses D3 v3 transitions to grow entering words and shrink exiting ones. Each word is colored via a d3.scale.category20 palette, with the data sourced from the Data Canvas Sense Your City Dataset.
AI-generated descriptionA scatter plot of Data Canvas Sense Your City Dataset.
MIT Licensed






Comments
Sign in to join the discussion.