🌍 Public
Examples exgm
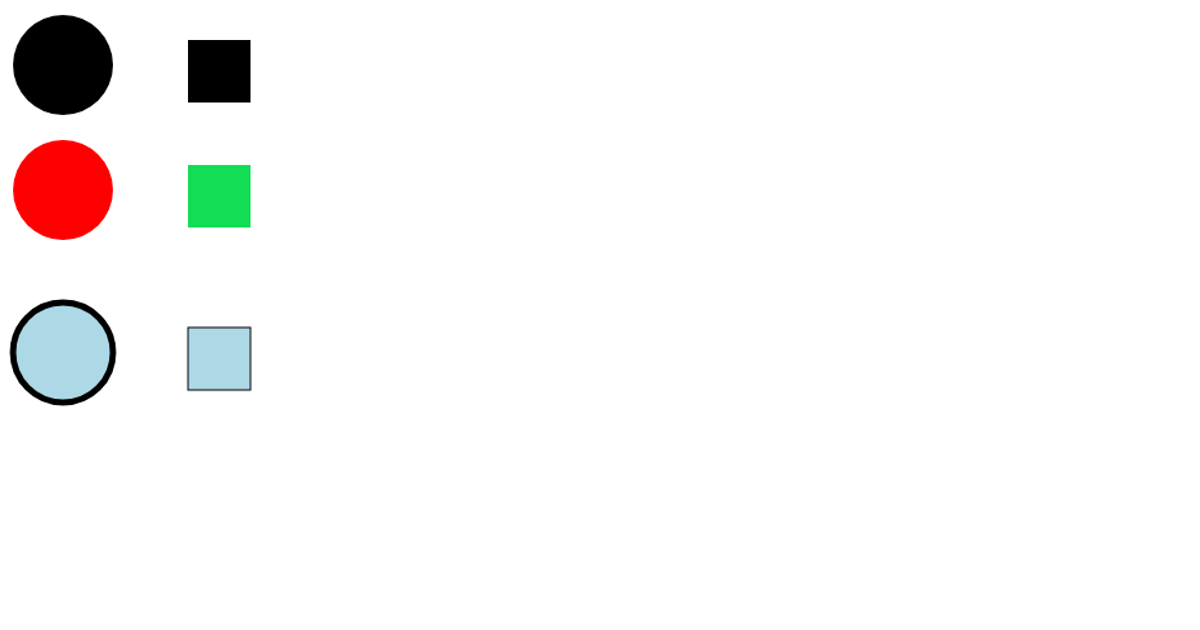
This example demonstrates a collection of SVG shapes, including circles, rectangles, and paths, rendered dynamically on a web page. It uses D3.js to bind data to SVG elements and apply interactive transitions, such as position changes and color shifts, upon user clicks. The visualization also employs CSS for styling and layout, while the shapes are generated programmatically rather than from an external dataset. The code highlights fundamental D3 selection, data-join, and transition APIs, serving as a foundational template for building custom SVG-based charts.
AI-generated descriptionA demonstration of SVG shapes.
MIT Licensed







Comments
Sign in to join the discussion.