🌍 Public
Vamsi_Reusable Scatter plot
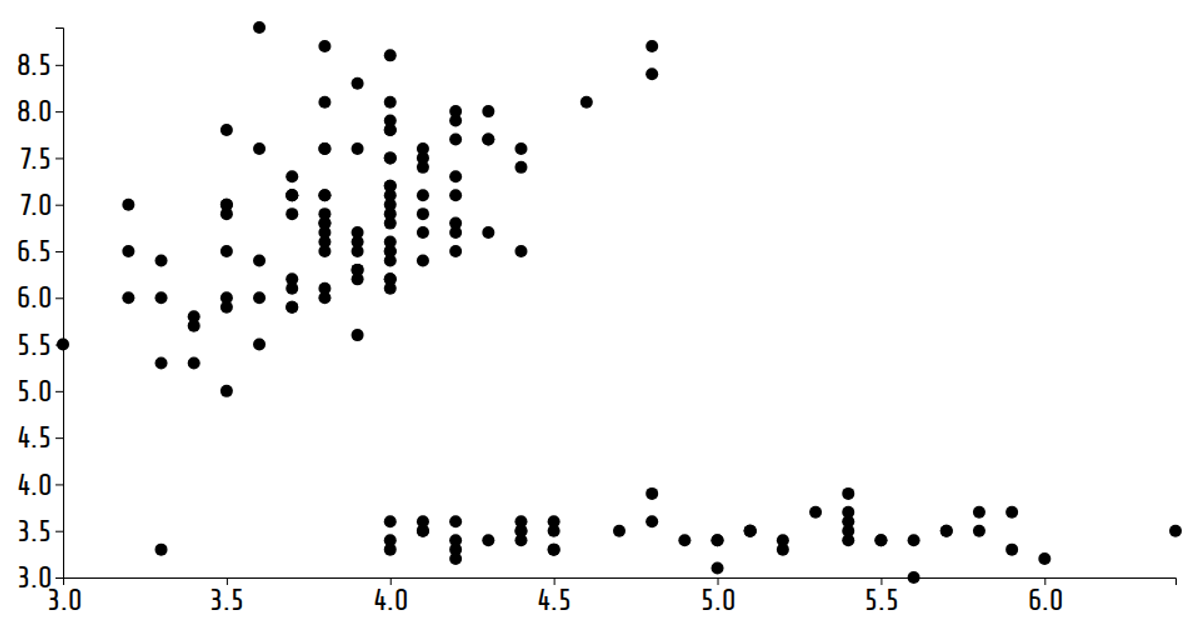
This interactive scatter plot visualizes the Iris dataset, animating through four different attribute combinations on the x-axis while keeping sepal length on the y-axis. The visualization cycles through petal width, sepal width, petal length, and sepal length using a setInterval function that updates the D3 scaleLinear axes and circle positions. The code uses D3 v6 APIs including csv for data loading, scaleLinear, axisLeft, axisBottom, and selection joins to render SVG circles colored by species. A custom scatterPlot function makes the chart reusable across different data mappings.
AI-generated descriptionA demonstration of reusable scatter plot.
MIT Licensed






Comments
Sign in to join the discussion.