🌍 Public
World Mapchoropleth
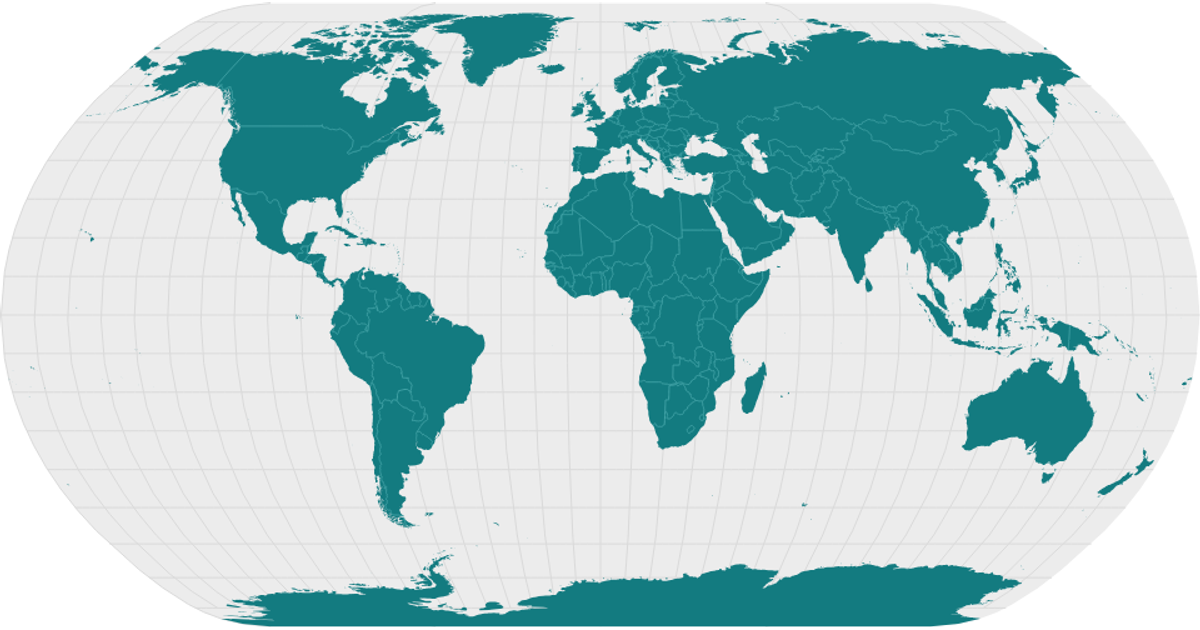
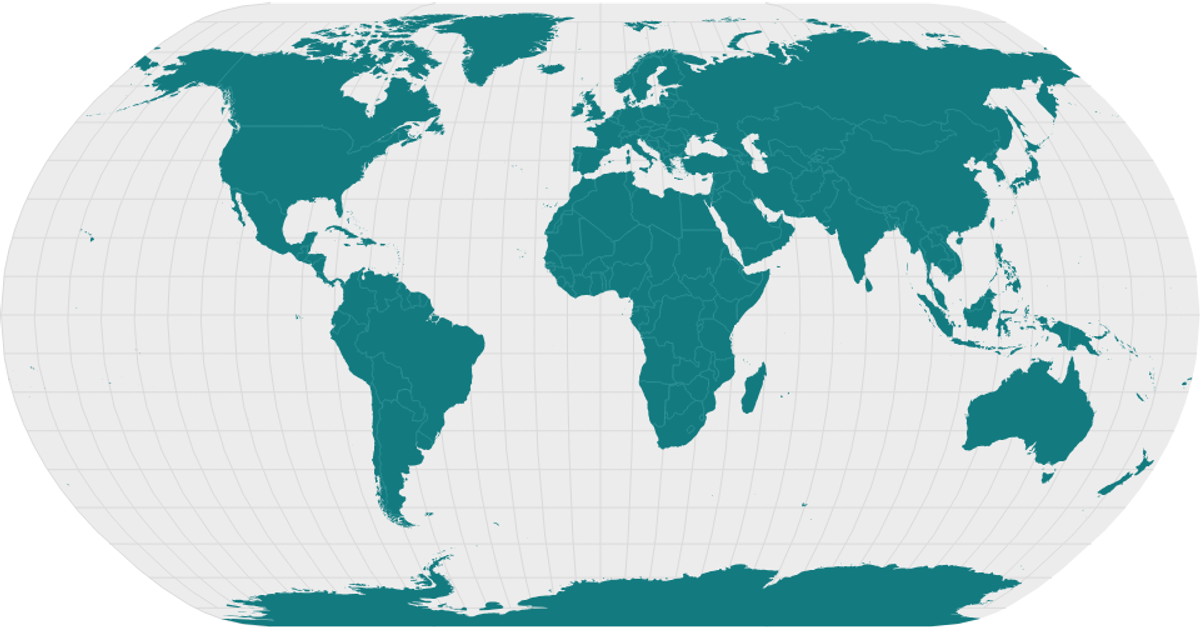
A world map displays country boundaries and graticules, with semi-transparent circles sized by the "Total Dead and Missing" statistic from a CSV of location coordinates. The visualization uses React with D3 v5, employing `d3.geoNaturalEarth1` and `d3.geoPath` for the map projection, `d3.geoGraticule` for grid lines, and a square-root scale for circle radii. Country shapes come from World Atlas TopoJSON, processed with `topojson.feature` and `topojson.mesh`.
AI-generated descriptionA world map showing country boundaries from World Atlas TopoJSON, polished for visual style, including graticules.
MIT Licensed


Comments
Sign in to join the discussion.