🌍 Public
Missing Migrants Final Project
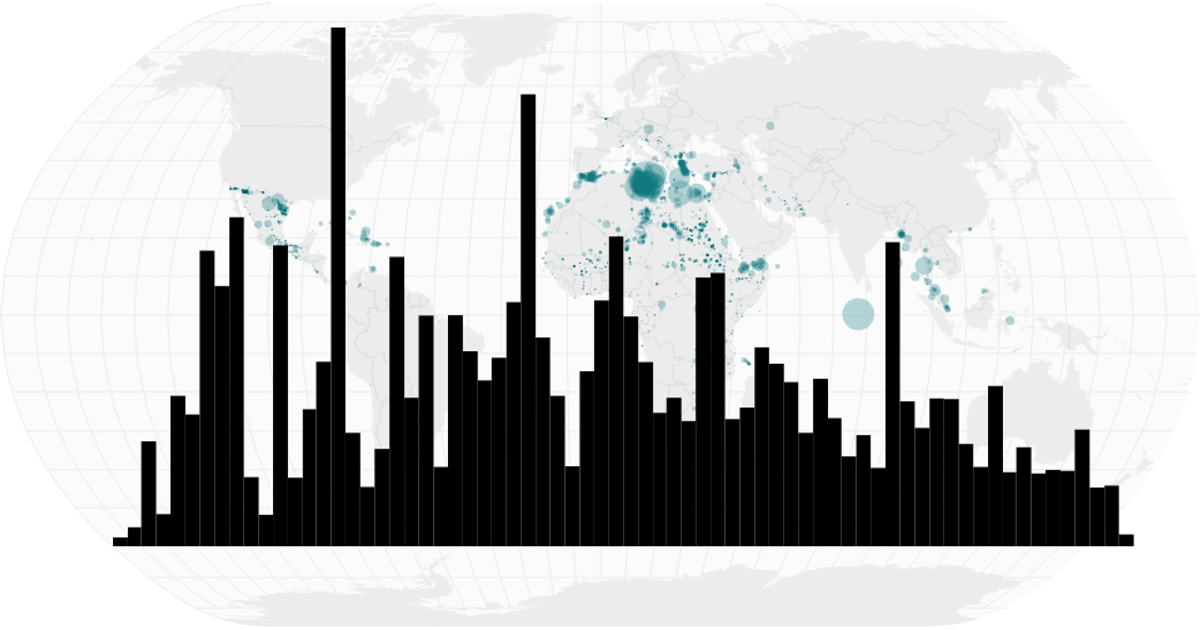
This visualization tracks the global count of missing and dead migrants over time, combining a world map with a timeline histogram. The map uses proportional circles to show the number of reported individuals at each location, while the histogram displays the same data aggregated by month. A brushable time range filters the map, updating the displayed circles dynamically. The project is built with React and D3 v7, using `geoNaturalEarth1` for map projection, `bin` and `timeMonths` for temporal aggregation, and `brushX` for interactive selection.
AI-generated descriptionHalf way towards a smiley face.
MIT Licensed




Comments
Sign in to join the discussion.